#humanresources
If you’re pregnant and anxious about delivering your baby in a hospital during this covid-19 crisis–especially in NYC–that’s entirely understandable. And protected under law.
And if you’re working and need flexibility from your employer due to severe pregnancy-based anxiety that’s affecting your ability to sleep, work optimally, etc., your employer must discuss your flexibility needs and ‘reasonably accommodate’ you. Your pregnancy is a protected status.
If you work in NY for any employer you are entitled to this pregnancy-based flexibility, and if you work anywhere else for a company with at least 15 employees you’re entitled to this discussion and reasonable accommodation analysis from your company.
You and your baby will undoubtedly be fine, as i’m sure your OB will agree, but your pre-term deep anxiety is still a thing. Put your concerns in writing.
And your company must take that into account. Stay strong.
#pregnantatwork#PWFA#pregnancydiscrimination#humanresources#hrlaw#emplaw
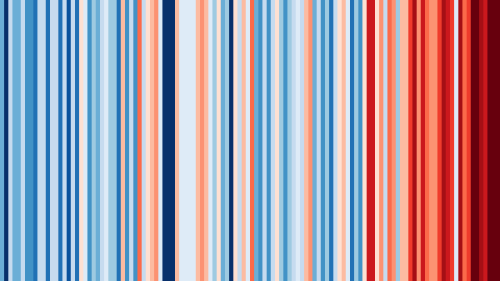
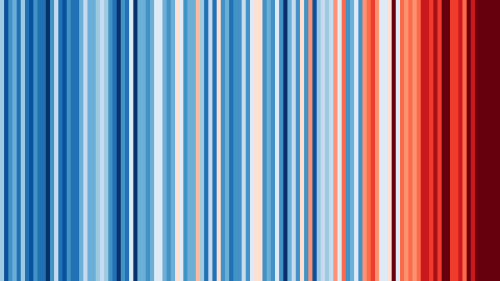
Professor Ed Hawkins’ data visualisation, Warming Stripes!
It started at Hay Literary Festival. Professor Ed Hawkins was trying to find a way to communicate climate change to an audience that might not be able to interpret scientific graphics or data.
Those stripes — shades of red and blue representing hot and cold temperatures — chart temperature changes from 1850 to 2018, running from left to right. They look like a bar code, albeit a vibrant one with a serious message. Hawkins, a professor of climate science at the University of Reading, says that the impact was immediately obvious.
That data visualisation was based on local temperatures for the festival’s location in rural Wales. Since the 2018 festival, Hawkins has worked on a graphic for global temperatures. Most recently, it took centre stage at a very different festival: as the backdrop for Enter Shikari’s set at Reading.
On 21 June 2019, the summer solstice, he launched a website where users can view and download climate stripes for the cities they live in, from Vienna to Verona. So far there have been more than a million downloads.
Warming Stripes from 1850-2020 for GLOBE / Europe / Asia / North America.
Courtesy: https://showyourstripes.info/ & designweek.co.uk/
Post link


