#acoustics
Midair crystallization.
It’s not magic, it’s acoustic levitation. The two metal probes emit and reflect sound waves that trap this liquid droplet in midair. Franziska Emmerling uses the effect to study crystallization without interference from container walls, which can influence the rate of crystal formation (Cryst. Growth Des. 2014, DOI: 10.1021/cg501287v). “In a typical experiment, we use an under saturated solution of a certain compound,” she says. “During the experiment, solvent evaporates from the droplet and the saturation level increases leading to nucleation and then crystallization.” In this photo, however, they’re just levitating blue ink to demonstrate the apparatus.
Emmerling (@FranEmmerling) submitted this photo as part of the #RealTimeChem photo contest on Twitter. The two runners-up in the Reactions category were Henry Powell-Davies (@hpowelldavies) with his balloon reaction and the Townsend lab at Vanderbilt (@Townsend_Lab) with a well-composed flask shot.
Credit: Courtesy of Franziska Emmerling
Do science. Take pictures. Win Money. Enter our photo contest here.
Related C&EN Content:
Lab Levitation, How Bubbly Is Bubbly?
Post link
Unconventional phenomena triggered by acoustic waves in 2D materials: Opening a new way to manipulate valley transport by acoustic methods
Researchers at the Center for Theoretical Physics of Complex Systems (PCS), within the Institute for Basic Science (IBS, South Korea), and colleagues have reported a novel phenomenon, called Valley Acoustoelectric Effect, which takes place in 2D materials, similar to graphene. This research is published in Physical Review Letters and brings new insights to the study of valleytronics.
[…]
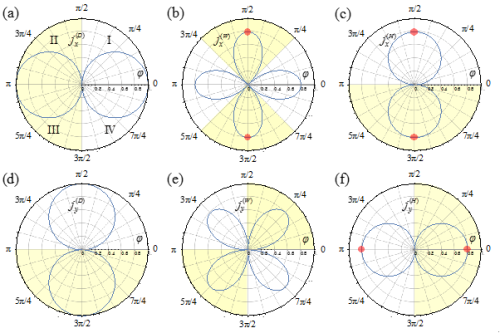
In acoustoelectronics, surface acoustic waves (SAWs) are employed to generate electric currents. In this study, the team of theoretical physicists modelled the propagation of SAWs in emerging 2D materials, such as single-layer molybdenum disulfide (MoS2). SAWs drag MoS2 electrons (and holes), creating an electric current with conventional and unconventional components. The latter consists of two contributions: a warping-based current and a Hall current. The first is direction-dependent, is related to the so-called valleys - electrons’ local energy minima - and resembles one of the mechanisms that explains photovoltaic effects of 2D materials exposed to light. The second is due to a specific effect (Berry phase) that affects the velocity of these electrons travelling as a group and resulting in intriguing phenomena, such as anomalous and quantum Hall effects.
Post link
Symmetrical Binding for Topological States
A new technique creates defects in a topological acoustic system that don’t destroy the system’s chiral symmetry, protecting its topological states.
[…]
In a material with a so-called topologically protected state, particles—electrons, photons, or phonons, for example—can move around boundaries in the material without losing energy or being scattered. One way to make a material with such a state is to add into its lattice one or more defects that violate the lattice’s rotational symmetry—for example, disclinations (line defects). However, such defects can break the lattice’s chiral symmetry, which helps protect the topological state. Now, Yun Jing of Pennsylvania State University and colleagues propose and demonstrate a way to ensure chiral symmetry is preserved in the presence of such a defect [1].
Post link
Laser-based ultrasound detects defect-producing features in metal 3D printing
Lawrence Livermore National Laboratory (LLNL) researchers have developed a new all-optical ultrasound technique capable of performing on-demand characterization of melt tracks and detecting formation of defects in a popular metal 3D printing process.
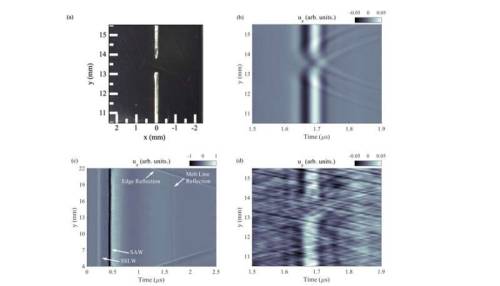
In a paper published by Scientific Reports, lab researchers propose a diagnostic using surface acoustic waves (SAW), generated by laser-based ultrasound, that can reveal tiny surface and sub-surface defects in laser powder bed fusion (LPBF) metal 3D-printing. The team reported the system they developed can effectively and accurately evaluate laser melt lines—the tracks where the laser liquifies metal powder in LPBF printing—by scattering acoustic energy from melt lines, voids and surface features that can be quickly detected. The team validated the findings using optical microscopy and X-ray computed tomography (CT).
“We hope that this work demonstrates the potential for an all-optical ultrasound system capable of rapid, on-demand in situ characterization of LPBF processes and powders,” said LLNL engineer and principal investigator David Stobbe. “The demonstrated laser-based ultrasound, surface acoustic wave system showed excellent sensitivity to surface and near-surface features, including breaks in the LPBF melt line, metal surface splatter and subsurface air voids.”
Post link
I slammed my fist against my table because I am so tired and angry but this pun is fucking gold
Post link
Went to see @thomasdybdahl last night at #UnionChapel mesmerising performance from Thomas and the band. Atmosphere and venue was beautiful. Acoustics were amazing. Thomas was lovely, humble guy he even signed my cast!
Thank you!
#music #atmospheric #gig #acoustics #islington #london_only #mesmerising #gratitude (at Union Chapel)
https://www.instagram.com/p/Bt5p5UYFKO0/?utm_source=ig_tumblr_share&igshid=1d3tyb551a8o1
Post link
Have you ever heard a frozen lake make the sound of Star Wars blaster? It’s actually a common occurrence! Our latest video looks at the science behind these sounds - a phenomenon called “acoustic dispersion.”
This question was asked today on Reddit’s /r/AskScience by /u/silverben10, and I decided to pitch in and give an in-depth answer.
Below is a reproduction of my answer there. I figured my Tumblr followers might enjoy it as well.
In order to understand this better, we gotta talk about the frequency spectrum of a sound.
An important result in mathematics is that any “reasonable” function (exact details of what’s “reasonable” don’t matter for our case, as I’ll explain in a bit) can be decomposed into a sum of a bunch of sines and cosines of different frequencies. This decomposition is called a Fourier transform of the function. Think of the sine and cosine waves as ingredients that you can add up together to make up the other wave. This is a great result because most functions are complicated, but sines and cosines are pretty simple.
Sound is a pressure wave, where pressure changes through time. So we can describe any sound by some pressure amplitude as a function of time, P(t). This is always going to be a “reasonable” function (pressure changes smoothly, doesn’t go to infinity, etc), so we can decompose it into sines and cosines using a Fourier transform.
Adding a sine and a cosine of the same frequency together just makes another wavy function that’s shifted around in time. That shift is called a phase. We can change the phase by changing how much of sine or how much of cosine we add together.

Here’s an animation I did showing how to make a sinusoidal wave of constant amplitude but different phase (in green) by adding together a sine wave (in red) and a cosine wave (in blue), just by changing the amplitude of sine and cosine.
To simplify the math, we usually turn these two into a complex number, which are a compact representation of amplitude (how tall the wave is) and phase (how much it’s shifted in time).

Here’s a diagram of that. The blue and red lines are the amplitudes of the sine and cosine wave in that previous animation. The yellow angle is the phase.)
So the Fourier transform of our pressure wave, P(t), is going to be another function, Q(f) that gives us a complex number for a given frequency f of a wave.
This is like if someone gave you a cake, and you ran it through a machine that told you all the ingredients that went into making it, how much of each ingredient was used (the amplitude) and when it was added into the mix (the phase).
So now, instead of talking about amplitude of pressure at a time t, we talk about the amplitude (and phase) for a frequency f.
Both are complete descriptions of the same thing, it’s just a change of perspective.
Now, when you hit a thing, you create a pressure wave that propagates through the object and bounces around inside of the materials that make it up. That energy goes into making it vibrate at several different frequencies.
The vibration of the surface of the object is what pushes air around and makes a pressure wave in air, which is what we hear as sound. We can use Fourier’s trick to find out which frequencies are in this sound generated by the object when we made it vibrate.
To better visualize this, we can create a “spectrogram”, which is just a graph that tells us how much of each frequency there is at each moment in time in the sound. This works by taking a “small slice” of the sound, running the Fourier transform on it, getting the amplitude of the complex number returned for each frequency, and squaring it. (The squaring part is important, because it’s related to the amount of energy on each frequency.)
Here’s a bunch of spectrograms of some sounds I made just for you. The vertical axis is frequency, and the horizontal axis is time.
The first two are the spectrograms for this sound file, which is the sound of a violin, clarinet, bassoon and trombone playing the same note (an F5 if I recall correctly, sorry, I already closed the program).
Linear scale spectrogram of four different instruments playing the same note.
The first graph is a linear scale. You can see how for each instrument, there’s a bunch of nice, equally spaced horizontal stripes. The lowest stripe is usually the brightest and longest, meaning it has the most energy in it and takes longer to decay. This is the fundamental frequency of the sound of the instrument: this is the note it is playing. The other stripes are called harmonics, and they are all nicely spaced because they are always integer multiples of that fundamental frequency. (Sometimes, there are also other stripes that are not exactly integer multiples. Those are called overtones, and create an even richer sound.)
Notice how all these lines line up for all four instruments, since they are playing the same note: the fundamental frequency and its harmonics all match.
This is what makes them all “tonal”. But the brightness changes between each, and also changes as time moves on (to the right) in different ways (different frequencies dissipate faster or slower for different instruments). It’s this unique mix of frequencies and how fast they decay that makes all of them sound different.
Tonal instruments all have this characteristic “stripey” pattern.

Logarithmic scale spectrogram of four different instruments playing the same note.
The second graph is the same graph as before, but now on a logarithmic scale. Here, you can see more easily the frequencies that make up most of the sound. (check the scale on the right).
On the other hand, I also recorded me punching my table, and did the same thing to it. That’s the last two graphs.

Linear scale spectrogram for the sound of a table being hit.
You can see that there’s no nice structure to the spectrum in that case. No stripes show up in the spectrogram. It’s just a mess, with a bunch of frequencies everywhere. (Those vertical lines are probably the different stuff on the table bouncing back on it.)
So there’s no easy way to pinpoint a “pitch”, because there’s no one frequency that stands out in the sound, along with those stripey harmonics that make it sound richer and more interesting. (A single line in the spectrogram would sound like a pure, constant tone, like a tuning fork. Boring!)
And that’s why some things don’t really have a noticeable “pitch”.
However, it’s important to note that everything DOES like to vibrate at particular frequencies. The spectrum of the table being hit shows us exactly which frequencies the table “likes” to vibrate at.
But if these frequencies are not sharply defined, then they don’t stand out in the spectrum of the sound the object makes, and neither will any of the harmonics stand out in relation to a fundamental frequency. They all just blend into a one big blob in the spectrum.
So the sound is just going to sound pitch-less, because there’s no immediately apparent “main frequency” for the sound.
Bonus stuff: But why does our *ear* and *brain* care about any of this frequency stuff?
Well, it turns out, our ears work because they are pretty much doing a Fourier transform of the sound we hear!
The key component of our inner ear is the cochlea, which is a spiral shaped thing full of liquid with a bunch of tiny little hairs inside. The tiny little hairs like to vibrate at specific frequencies too, and when sound comes into the cochlea they vibrate and produce an electric signal.
So the cochlea and its little hairs are acting pretty much like the Fourier transform. This is why frequency components are so important to the way we hear.
Listen up now | #martinique #fortdefrance #france #acoustics #sound #acoustika (at Fort-De-France Centre Ville)
Post link
Tattoo Inspirations: Aguasonic Acoustics
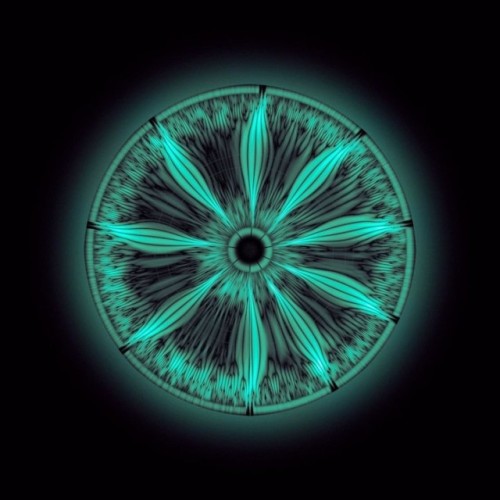
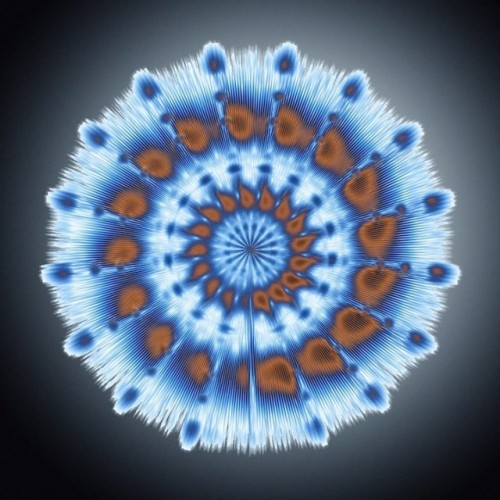
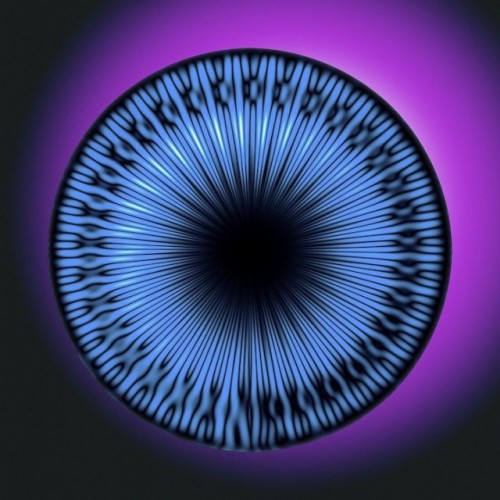
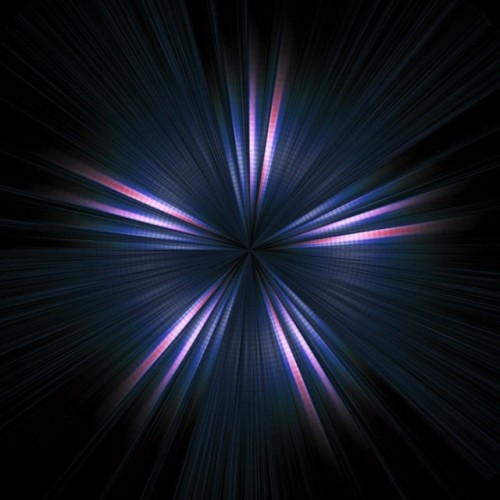
Visualizing animal sounds with the help of mathematics and computer programming is how engineer, Mark Fisher, created these beautiful, kaleidoscopic images from the songs of dolphins, whales, birds and insects. Raven and I turned on one of our young clients to these fractal-like images as inspiration for her tattoo soulprint of dolphin and owl energy.
1. White Beaked Dolphin 2. Atlantic Spotted Dolphin 3. False Killer Whale 4. Spectacled Owl 5. Blue Whale 6. Humpback Whale 7. Minke Whale 8. Cricket
Too see more of Mark Fisher’s work visit: www.aguasonic.com.
Post link


