#clinton


Iconic First Ladies of the United States
1. As First Lady, Dolley Madison founded an orphanage for girls in Washington, D.C., and redecorated the White House to give it a more stately look. Check out our website on Mrs. Madison.
2.Eleanor Roosevelt was an early civil rights activist, insisting that New Deal benefits be extended to African Americans in an equal manner. Check out our website on Mrs. Roosevelt.
3.Jacqueline Kennedy renovated and refurbished the White House, while also extending support for the arts in America. Check out bios of Kennedy women here.
4. National beautification became Lady Bird Johnson’s cause of choice. She led efforts in improving physical conditions in Washington, D.C., in particular. Check out our website on Mrs. Johnson.
5.Rosalynn Carter sat in on Cabinet meetings (which was then unprecedented) and supported reform for mental health legislation and aiding senior citizens. Learn more about Mrs. Carter here.
6.Hillary Clinton headed the Task Force on National Health Care Reform and traveled to over 75 countries during her time as First Lady. Read our biography of Mrs. Clinton here.
(All photos via Library of Congress.)
Post link


Tune in to the first joint candidate event of the 2016 general election!
Hillary Clinton and Donald Trump will take questions on national security, military affairs and veterans’ issues from a live audience comprised of service members and veterans on the Intrepid Sea, Air & Space Museum.
Post link

Clinton surges past 270 electoral votes in new battleground map
We’ve updated our NBC battleground map. The states in Hillary Clinton’s column now add up to 288 electoral votes, which exceeds the 270 needed to win the presidency. Donald Trump, meanwhile, is at 174 electoral votes, and an additional 76 are in the Tossup category. Our last map, back in July, showed Clinton with a 255-190 advantage — so Clinton’s tally has gone up since the conventions, while Trump’s has declined.
The significant changes in our map:
- We’ve moved Colorado, New Hampshire, North Carolina, Pennsylvania, Virginia, and Nebraska’s one electoral vote from Tossup to Lean Dem.
- We’ve also moved Florida from Lean Dem to Tossup.
- Georgia moves from Lean GOP to Tossup.
- And we’ve changed Kansas and South Carolina from Likely GOP to Lean GOP.
(Our regular caveat here, of course: These designations are subject to change as we get more poll numbers and reporting.)
Explore more here: http://on.msnbc.com/2bxZx7G
Post link
Trump calls Obama the “founder of ISIS”
Donald Trump on Wednesday night appeared to blame President Barack Obama for the global terror threat, erroneously accusing him of creating ISIS and saying the group “honors” him.
“In many respects, you know, they honor President Obama,” Trump said at a rally in Florida. “He’s the founder of ISIS. He’s the founder of ISIS. He’s the founder. He founded ISIS.”
Trump continued: “I would say the co-founder would be crooked Hillary Clinton.”
And then he doubled-down on his comments. Read more here: http://on.msnbc.com/2b1qldw


Greater Austin Presidential Election Results 2016
This map depicts the results of the 2016 Presidential Election within the Greater Austin, Texas metropolitan area. It includes Travis, Williamson, Hays and Bastrop Counties, but not Caldwell*. Votes are shown as dots, where one dot represents 3 votes. For a more precise demonstration of voter preference, as well as their density and distribution, results are mapped at precinct level and dots have only been plotted within residential properties.
Votes for Hillary Clinton are colored cyan; votes for Donald Trump are colored magenta. Third-party votes are not shown. Brighter areas indicate larger concentrations of votes.
::
It’s a pretty common political axiom in the United States to refer to cities as “islands of blue in a sea of red”. The saying comes from the pattern produced by residents of urbanized areas tending to vote for Democrats (symbolized as blue since the 2000 election) along with rural voters tending to prefer Republicans (symbolized in red). On typical county-level post-election maps, these urban area stick out as small blue areas completely surrounded by red.
Geographers and demographers (and Democrats) tend to object to that depiction because it misleadingly implies that vast swaths of the country are filled with Republican voters. While it’s true that rural counties tend to lean Republican (often heavily so), it’s also true that those counties are often sparsely populated, consisting of vast tracts of uninhabited wilderness and farmland/ranchland. (See my Nobody Lives Hear map for an illustration of the unpopulated portions of the country). As the saying goes, “land doesn’t vote”.
Some cartographers try to compensate for this effect by distorting the representation of the land to reflect population counts, or using a gradient to indicate the winner’s margin (or sometimes both). Others have tried making the map 3D, using height to show the total number of voters in each county. The result is a scattering of tall spikes showing urban voters and lots of flat low-population counties. Another intriguing, but underutilized, method is to fade counties in proportion to their population.
As an alternative approach for this map, I revisited the dot density style I began playing with earlier in the year. Though the map is drawn at the precinct level, the same principles apply as with county-level maps. Variations in precinct area and population can over- or under-emphasize the patterns of the local geography when using a less sophisticated presentation style. Indeed, precinct measurements illustrate the phenomenon perfectly. Precincts Trump won measure 2814 sq.mi. (7289 sq.km.) in area, while those that Clinton won measure a comparitively small 906 sq.mi. (2348 sq.km).
By drawing votes as dots and limiting them to the places people live, nuances in geographic distribution becomes plain to see. The “blue island” shines clearly, but “sea of red” is revealed to be the largely unpopulated space that it is.
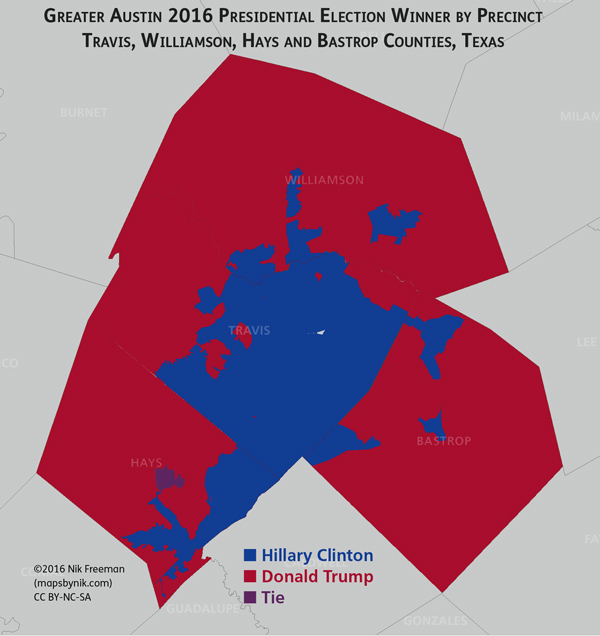
This simplistic winner-by-precinct map shows the blue island/red sea concept. Despite being three times larger in area, the precincts won by Donald Trump contain significantly fewer voters than those won by Hillary Clinton.
Travis County, which has a reputation as a Democratic stronghold, shows that Hillary Clinton’s strength was concentrated primarily in Austin’s central urban corridor. She won many densely populated urban precincts with 80-90% of the vote. And while the residents in west Travis did lean toward Trump, they were fewer and more spread out compared to Clinton’s voters. His highest portion of the vote topped out in the mid-60s.
North of Travis, Williamson County features an interesting gradient fading from blueish-purple in the southern portions of the county near Austin to the distinct magenta of the Trump-supporting suburb of Georgetown in the north, where he pulled about 70% of the vote.
Hays County was a virtual squeaker, with only 613 votes separating the two candidates. Clinton won respectable majorities in the developed cities along Interstate 35 in the southeast portion of the county (56+% in Kyle and Buda), and dominated San Marcos, home to Texas State University. There, she took 70-75% of the vote. But it wasn’t quite enough to counter the county’s rural areas where Trump won 60-65%.
Finally, in Bastrop County, Clinton won narrow majorities (low 50s) in the more developed areas, namely Bastrop proper, Elgin and near Elroy on the border with Travis County. The remainder of the county went heavily for Trump, scoring totals between 55-75%.
::
Further examination reveals some potentially promising trends for Texas Democrats. Hillary Clinton exceeded Barack Obama’s 2012 vote percentages in Travis, Williamson and Hays Counties by 6.2, 3.5 and 3.1 points, respectively. She even beat his blowout 2008 margin in Travis by 2.8 points. Bastrop, however, was not as favorable to her, losing 3 points compared to Obama 2012. It’s a small county though, and those lost votes were offset by increases in the other counties. Across the four-county area, Clinton showed a 4.2 point improvement over Obama’s 2012 results and a 0.5 point increase over his 2008 numbers.
The picture is not so rosy on the Republican side. He may have won the State of Texas, but Trump’s performance across these four counties was down significantly compared to Mitt Romney or John McCain. He beat McCain’s numbers in Bastrop by 4 points, but that was his only improvement over previous elections. Romney beat his results in Bastrop by 0.3 points. In Williamson, Trump underperformed Romney by 8.3 points. In Hays, it was 6.6 points and in Travis, 8.8 points. Trump underperformed McCain by 4.6, 2.3 and 6.9 in Williamson, Hays and Travis, respectively. Overall, his percentage of the vote fell 5.1 points short of 2008 and 8.3 points short of 2012.
That 8.3 point drop in support seems to have been evenly split between Clinton (her +4.2 over Obama) and third-party candidates, who increased their share from 2.5% to 6.8% (+4.3 points) this year compared to 2012.
::
I found this to be a fascinating look at the Capital of Texas’s electoral geography for 2016. I hope other folks are as intrigued by the visualization as I have been. In the metro area, there’s a some red, a lot of blue, and a fair amount of purple.
*OMB includes Caldwell in its definition of the Austin-Round Rock Metropolitan Statistical Area. I don’t have property zoning data for it though, so it has been omitted. Plus, with only 11,486 total presidential votes cast, those results would have barely been visible on the map.
© Nik Freeman | mapsbynik.com2016
Creative Commons Attribution-NonCommercial-ShareAlike
Election results, precinct boundaries, and parcel data from county governments and central appraisal districts
Road lines from OpenStreetMap
Hand-crafted using Python, PostGIS and TileMill
Mercator Projection
Post link

It’s the 2016 primary election season in the United States and this map represents a small part of it. It depicts the geographic distribution of votes for Hillary Clinton and Bernie Sanders in Travis County, Texas (home to Austin, the state’s capital city) during the Democratic Presidential Party on “Super Tuesday”, March 2.
The dots on the map represent voters. They were generated from the precinct-level election returns published by the Travis County Clerk’s office. Yellow dots represent votes for Sanders, while turquoise dots represent votes for Clinton. To give a sense of where groups of supporters live, the dots are constrained to cadastral parcels zoned for residential use. Dots are drawn randomly within each precinct and parcels; they do not represent the locations of individual voters.
Despite losing the state, Sanders won the county by about 4600 vote. Not a great surprise, given the county’s left-leaning reputation. Some general observations:
- Clinton actually won more precincts, 130 to 109.
- But those wins were of smaller magnitude compared to Sanders’. Clinton’s precincts were won by an average of 78 votes while Sanders averaged nearly double the margin with 142 votes per precinct.
- Geographically, Sanders showed extremely strong support in downtown neighborhoods, especially at UT–Austin and its surroundings. In the precinct housing most of the dorms, Sanders ran up a huge 5.5X, +1419 vote win. Impressive margins for Sanders were also found in the West University (+924), Pleasant Valley (+759) and Parker Lane (+622) neighborhoods.
- Clinton scored the most lopsided victory, 52 to 8 (6.5X margin), in Webberville in the southeast portion of the county.
- Clinton’s strongest areas of support came from the neighborhoods along RM 2222 west of Mopac, and on both sides of the river, scoring a handful of solid +200 to +300 vote victories. Additional strong showings were found at the Circle C Ranch developments in the southwest of the county and the Pecan Springs Springdale neighborhood in eastern Austin.
::
Election maps are always fun and I enjoyed putting this one together. The use of parcel data to limit the geographic extent of the symbology was a bit of an experiment for me. I think the results turned out well, revealing more detailed patterns among the candidate’s supporters than would have been revealed otherwise.
P.s. - For the curious: yes, I did look at the Republican Primary results as well. They weren’t that geographically interesting though, so I’m not likely to publish a map about it.
© Nik Freeman | mapsbynik.com2016
Creative Commons Attribution-NonCommercial-ShareAlike
Election results from traviselectionresults.com
Precinct boundaries from the Travis County Tax Office
Parcel boundaries from Travis Central Appraisal District
Road lines from OpenStreetMap
County boundary from U.S. Census Bureau
Hand-crafted using Python, PostGIS and TileMill
Mercator Projection
Post link


Queen of the Hill: The World’s Best Hillary Impersonator Is Ready for 2016
We traveled to a gated community in Palm Desert, California, to meet Teresa Barnwell, the world’s most successful Hillary Clinton look-alike.
Post link


