Justin is of a new generation of artists who may not even consider themselves artists in the pure sense. He spends his days coding for google. All artwork is coded and generative meaning that it is constantly changing and is different at any point in time that you may be viewing it. The pictures above are merely screen captures of some of his artwork. To view as intended, they must be viewed in a WebGL enabled browser such as chrome.
Have you ever sketched using a program? It’s pretty fun isn’t it? What about if you can code your own software and make the most imaginative art?
Reza is a San Francisco based computational designer/multimedia engineer. He’s one of those rare butterflies and we are thrilled to have him in our 7E community. As a designer/engineer, he creates generative visuals and algorithmic art. He pushes the limit of media technology and helps to pave the possibilities of art and entertainment. He’s worked with Motion Theory, POSSIBLE, and Visual Complexity to name a few.
Here are a select few out of countless of digital sketches.
Stefanie Posavec is an London-based data artist with an MA in Communication Design (Central Saint Martins). With a background in book design and text visualisation, she works as a designer with a focus on data-related design, with work ranging from data visualization and information design. She is commissioned for data art and data illustration for a variety of clients. Her personal work focuses on the visual representation of language, literature, or numbers and has been exhibited internationally.
Oliver Byrne was an Irish mathematician and engineer in Victorian England. He is most famous for his colorful versions of Euclid’s elements of geometry, which were published in 1847 by William Pickering. The book was one of several British books displayed at the Great Exhibition of 1851. Byrne’s intention in creating the book was to use as little written language as possible and instead focus on creating visual representations of Euclid’s theories. It was one of the earliest books printed in the Victorian era with multiple colored inks.
This book is currently on display in our pop-up exhibit cases as part of Historic Data Visualization. Read more about the exhibit on our blog or stop by the Rare Book and Manuscript Library to see it in person!
Byrne, Oliver. The first six books of the elements of Euclid, in which coloured diagrams and symbols are used instead of letters for the greater ease of learners. London: William Pickering, 1847. 516.2 Eu2by.
Water Sources and Usage in Sweden’s Water Districts | March 2016
Infographic demonstrating the geographic locations and characterizations of Sweden’s Water Districts. Data demonstrate sources of water (ground water, surface water, sea water), population plotted against annual public and private water usage, and change in total water usage over the past 25 years.
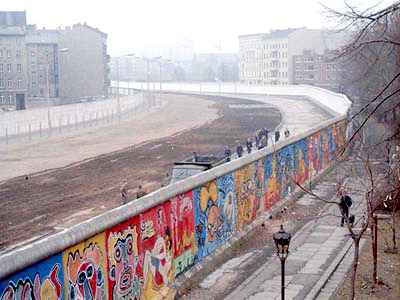
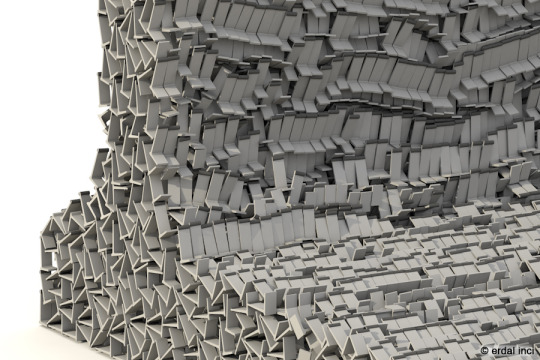
When we think about the Berlin Wall, despite having an idea of how its length, we can’t easily envisage its real size. With this question in my mind, I decided to create a computer generated 3D model of the wall compiled together in a single frame.
I started by conducting some research on Wikipedia:
“The “fourth-generation wall” (Grenzmauer 75) , known officially as “Stützwandelement UL 12.11″ , was the final and most sophisticated version of the Berlin Wall. Begun in 1975 and completed about 1980,it was constructed from 45.000 separate sections of reinforced concrete, each 3.6 metres high and 1.2 metres wide. The concrete provisions added to this version of the Wall were done so as to prevent escapees from driving their cars through the barricades (“L” shape structure).The top of the wall was lined with a smooth pipe, intended to make it more difficult to scale. This version of the Wall is the one most commonly seen in photographs, and surviving fragments of the Wall in Berlin and elsewhere around the world are generally pieces of the fourth-generation Wall.“
The next step was to make a 3D model of a single segment from its blueprint and then duplicate it 45 thousand times. At that point I needed to decide how to compose all the pieces, so I ended up placing them together in the same proportions all from of a single segment. Doing this ensured that we are able to see both the shape of a single segment, on a larger scale, with more detail and the entire quantity that makes up the wall (exactly 45K pieces) together.
To envisage the actual size of the wall, the colossal structure (240 metres high) was placed in Alexanderplatz in true scale.
Another step of the project is to have a 3D printed version of this fractal design in 1:1 scale (3,6 meters). So the viewer can easily recognise its form from a distance and upon closer inspection the wall can be viewed in its entirety. I am in search of commissions or sponsors to have it printed. Please contact me if you are interested.
To demonstrate the 3D printed structure in real scale, it was virtually inserted next to original wall segments at Berlin Wall Gallery of Newseum in Washington, D.C. Photo Credit: Sam Kittner/Newseum
In this animation you see the whole fractal structure (exactly 45.000 segments) with a collapsing simulation. The original full length animation piece is available in 5+1 editions and FullHD resolution.
Please check my site for more info! >>> erdalinci.com
It can be helpful to visualize this number when talking about very small probabilities like dying in a plane crash and doing so can help put more pressing health conditions into perspective, such as the fact that we are approaching a time where 50% of people will develop diabetes in their lifetimes.
Do your part - use literally anything other than Google Chrome
Reminder that switching to Firefox is incredibly easy and takes just a few minutes, you WILL be able to copy over all your cookies, browsing history, logins etc, as well as change the look/layout so it feels like what you’re used to.


