#fluid mechanics

Today I learned that some fish are so hydrodynamic that a dead fish can swim upstream.
Why they swim so fast (fluid mechanics)
Harvard “passive propulsion in vortexes” study

 : Smoke from an Incense stickIn this set of images the smoke from an incense stic")
 : Smoke from an Incense stickIn this set of images the smoke from an incense stic")
 : Smoke from an Incense stickIn this set of images the smoke from an incense stic")
Flow galleria (#2) : Smoke from an Incense stick
In this set of images the smoke from an incense stick is seen making a transition from a smooth laminar flow (very close to the incense stick) to a turbulent flow (far away from the incense stick) while passing through the Kelvin-Helmholtz instability (rolling vortices).
** This post is part of the ‘Flow series’ by FYPhysics and EcstasyShots!. Check out the previous posts here.
Post link
Flow(#2) - Plateau- Rayleigh Instability
In this week on FYPhysics! we will be talking about the classic Plateau-Rayleigh Instability. Stay tuned!
** This post is part of the ‘Flow series’ by FYPhysics and EcstasyShots!. Check out the previous posts here.
Let’s ask a very generic question:
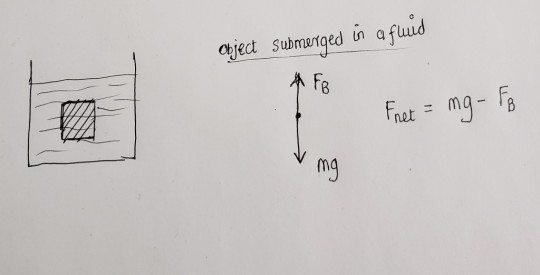
I hand you an object and ask you to predict whether the object would float or sink. How would you go about doing that ?
Well, you can measure the mass of the object and the volume of the object and can derive this quantity called Average Density

It is the average density of the entire object as a whole. If this object is submerged in a fluid of density , then we can draw the following force diagram:


Fun Experiment:
If you drop some raisins in soda, you will notice that they raise up and fall down like so (Try it out!):
This is because air bubbles that form on the top of the raisin decrease its average density to the point that its able to make the raisin raise all the way from the bottom to the top.
BUT once it reaches the top all the air bubbles escape into the atmosphere (its average density increases) and the raisin now falls down.
Questions to ponder:
- Why do people not sink in the dead sea ?
- How are submarines/divers able to move up and down the ocean ? How would you extend the average density argument in this case.
- Why do air bubbles in soda always want to raise up ?
- If the total load that needs to on a ship is 25 tons. What should be the total volume of the ship in order to remain afloat if the density of sea water is 1029 kg/m3,
** This post is part of the ‘Flow series’ by FYPhysics and EcstasyShots!. Check out the previous posts here.
One of the most surprising things about air that may not be intuitive is that it is a fluid and like any other fluids exerts a pressure on objects.
Standing on earth with layers of air above us, we are constantly being ‘weighed down’ by a pressure of ~1atm at all times.
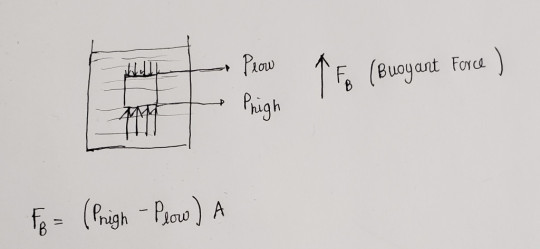
All objects in air are also assisted by a buoyant force that is caused from the pressure difference between the top and bottom surfaces.
Let’s now consider the hot-air balloon in particular. A force diagram is probably the best way to start:

Therefore we see that in order for the hot air balloon to float, we need to have the buoyant force compensate for the net weight from the balloon, the load on it and the air inside it:
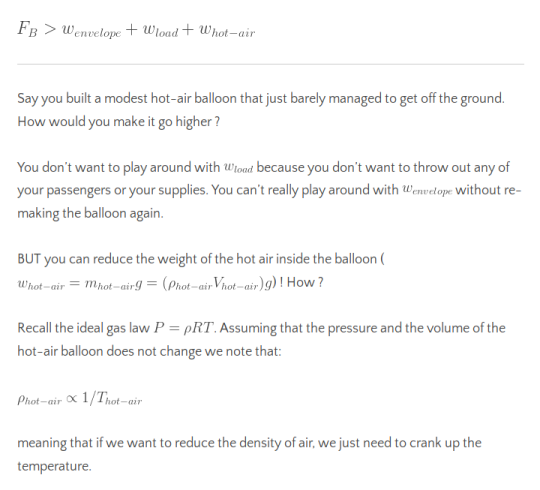
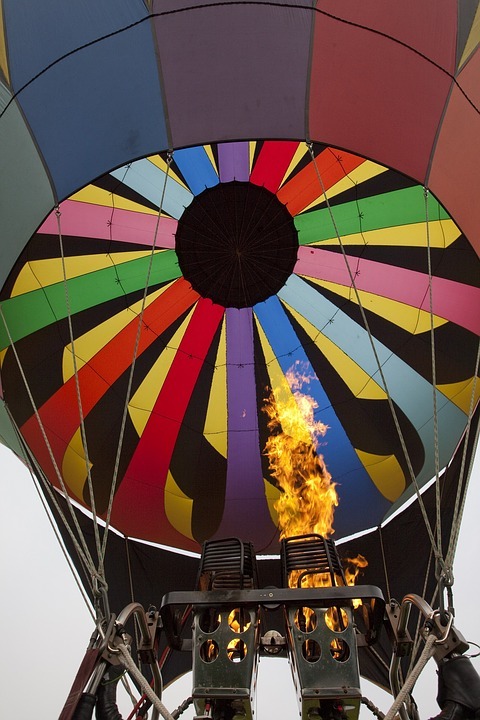
And with a spectacular burner onboard our hot air balloon, we can easily increase the temperature of the air inside the balloon!
That’s pretty much how hot-air balloons work! You increase the temperature of the air inside the balloon to go up, decrease the temperature to go down and skillfully adjust the temperature to hover.
Have a great day!
Questions to ponder:
- When you increase the temperature of air, its density decreases. What do you think happens to all the molecules that were previously inside ? Do they exit the balloon ?
- Different shaped hot-air balloons is a common sight. Do you think that the Buoyant force changes for each shape?
- How do you think Helium balloons work ?
Buoyancy
In the first post of our fluid mechanics series : ‘Flow’ we explore the concept of Buoyancy. Click here to check out the post exploring the physics of Buoyancy.
Have a great day!
* Check out the video description on YouTube on the details of how buoyancy is related to each clip in the video
Flow
Premiering in the summer of 2019 is a web series that we have been working on titled ‘Flow’ which is aimed at expressing the beauty of Fluids through the looking glass of a slow motion camera.
Here is a trailer to the upcoming series. Hope you guys enjoy it!
–
FYPhysics! & Ecstasy Shots!

This week NASA released the first-ever image of shock waves interacting between two supersonic aircraft. It’s a stunning effort, requiring a cutting-edge version of a century-old photographic technique and perfect coordination between three airplanes – the two supersonic Air Force T-38s and the NASA B-200 King Air that captured the image. The T-38s are flying in formation, roughly 30 ft apart, and the interaction of their shock waves is distinctly visible. The otherwise straight lines curve sharply near their intersections.
Fully capturing this kind of behavior in ground-based tests or in computer simulation is incredibly difficult, and engineers will no doubt be studying and comparing every one of these images with those smaller-scale counterparts. NASA developed this system as part of their ongoing project for commercial supersonic technologies. (Image credit: NASA Armstrong; submitted by multiple readers)
How do these images get captured?
It may not obvious as to how this image was generated because if you have heard about Schlieren imaging what you have in your head is a setup that looks something like:
But how does Schelerin photography scale up to capturing moving objects in the sky?
Heat Haze
When viewing objects through the exhaust gases emanating from the nozzle of aircrafts, one can observe the image to be distorted.

Hot air is less dense than cold air.
And this creates a gradient in the refractive index of the air
Light gets bent/distorted
Method-01 : BOSCO ( Background-Oriented Schlieren using Celestial Objects )
You make the aircraft whose shock-wave that you would like to analyze pass across the sun in the sky.
You place a hydrogen alpha filter on your ground based telescope and observe this:

Notice the ripples that pass through the sunspots
The different air density caused by the aircraft bends the specific wavelength of light from the sun. This allows us to see the density gradient like the case of our heat wave above.
We can now calculate how far each “speckle” on the sun moved, and that gives us the following Schlieren image.

Method-02: Airborne Background Oriented Schlieren Technique
In the previous technique how far each speckle of the sun moved was used for imaging. BUT you can also use any textured background pattern in general.
An aircraft with camera flies above the flight like so:

The patterned ground now plays the role of the sun. Some versions of textures that are commonly are:

The difficulty in this method is the Image processing that follows after the images have been taken.
And one of the main reasons why the image that NASA has released is spectacular because NASA seems to have nailed the underlying processing involved.
Have a great day!
* More on Heat hazes
** More on BOSCO
*** Images from the following paper : Airborne Application of the Background Oriented Schlieren Technique to a Helicopter in Forward Flight
**** This post obviously oversimplifies the technique. A lot of research goes into the processing of these images. But the motive of the post was to give you an idea of the method used to capture the image, the underlying science goes much deeper than this post.
Post link
 : Magic of a bright striped backgroundOne of the easiest way to visualize fluid p")
 : Magic of a bright striped backgroundOne of the easiest way to visualize fluid p")
 : Magic of a bright striped backgroundOne of the easiest way to visualize fluid p")
Flow Galleria (#6) : Magic of a bright striped background
One of the easiest way to visualize fluid phenomenon is by placing your fluid on top of a bright striped background. And by measuring the deviations of this striped pattern, it is possible to infer a lot of sensible data such as the changes in density of the fluid and so on. In this post, this technique is demonstrated in water using an alternating red-black striped pattern as the background.
If the region of interest is only the surface on the other hand, the bright striped pattern can be made to reflect off the top of the fluid surface. We demonstrated this technique in our ‘Water is diamagnetic: A simple experiment’ post which you can check out here.
Cheers!
Post link

“Highly magnetizable superparamagnetic colloidal aggregates with narrowed size distribution from ferrofluid emulsion
Volodymyr Lobaz, Robin N. Klupp Taylor, Wolfgang Peukert, ”
Post link