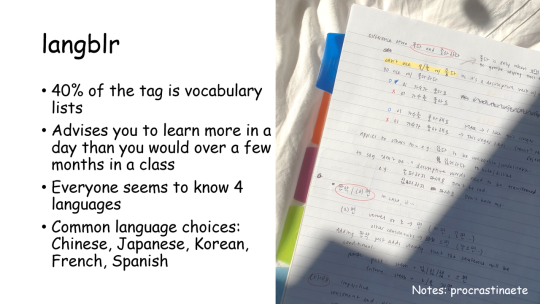
#mathblr


i went out of my way to take screenshots of my notes to post them… 3 weeks ago smile
writing chinese characters in the margins helps me stay at least semi focused (as opposed to drawing/thinking of other things/sneaking peeks at memes) so a lot of my notes and the print outs i’m given in topology are just chock full of hanzi from basically HSK 1 (we’re using a taiwanese textbook)
somehow my middle-of-the-semester tests went well so that was nice and ive been managing to use notion to keep things organized for 2 months now


decided to show off my notion *:・゚★*:・゚☆
i mostly see people using the inbuilt “not started” “in progress” and “completed” tags but as someone who is the complete opposite of a perfectionist i really needed that “close enough xddd” tag
i really want to make the layout more cohesive but this is the only way it can look normal on both a computer and an ipad
also wish they gave us the power to put pictures next to databases alreadyyyyy

Imagine finding out 2 days before the test that an effective estimate and sufficient statistic are both statistics
Can’t be me
So I made this summary mindmap beast in an attempt to remember all the formulae for the test tomorrow


Well I sure disappeared.. for a while….
I somehow managed to get semi normal grades last semester and now that I’m on meds i’m actually showing up to class and getting those sweet ‘go up to the board and do an exercise’ participation points
I also picked up mandarin chinese 1 but the class is slugging along so i’m learning HSK 1 grammar points in my own time for fun as well as cursive hanzi writing
Pics: chinese, math stat 2, renormalization methods in qft, stuff for my masters thesis which im starting very late cause reasons
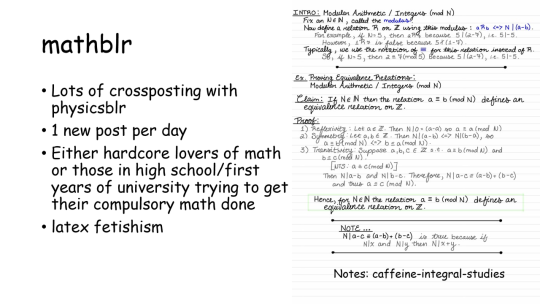
So I keep seeing posts on studyblr about how to take notes, some of them “official” methods like the Cornwell method or whatever it’s called, others more based on personal experience/ideas, but basically all of those don’t work well with math and physics.
So I made examples of how I take notes in physics and math, which based on what I’ve seen from professors and other students is pretty standard. (Blue text is commentary on the notes)

In math always start by defining the variables, because you will forget and you need to know all the assumptions you’ve made (like “did I define the function f as continuous, differentiable, bijective or just continuous and bijective?”). Drawings are good since they help visualise the abstract stuff (and look pretty), but not necessary. Always write down definitions, theorems, and lemmas, and ESPECIALLY their proofs. Exercises (both proof exercises and application exercises should be written down too, with varying detail based on how easy it is for you.
In math, and a bit less so in physics, you should always try to use mathematical symbols to shorten text. For the theorem I wrote what I would actually write in white, and below in blue I wrote the full, no symbol version of that. It’s pretty obvious which will be written down faster in class.
And never forget to write that sweet little quod erat demonstratum square at the end of a proof.

In physics the only thing you ALWAYS have to write down is a work through of an exercise or proof (this, of course, includes defining the variables, unless you’re the same variables as last time and can refer back to those). Since physics is about THE REAL WORLD you should strive to draw diagrams constantly, since sometimes you won’t be able to find a solution until you draw the diagram and examine the system (some proofs, especially those in optics, rely heavily on diagrams to explain what the fuck is even going on).
Unlike in math, in physics everything has a unit, which you should ALWAYS mark SOMEWHERE, because you might figure an exercise out solely based on your knowledge of units.


01.10.20
Guess who has not been using notion cause they’re not used to writing tasks down and marking them complete, nor doing them on time (hint: it’s me).
Somehow (thanks to focusing hard on it and working through it religiously) I actually get probability theory 2 now, but now functional analysis 2 is the issue (but at least the professor for this is normal).
I’ll be having my first tests in a few weeks and I am not emotionally ready for that.
Figure 1: we got an extra practice lesson with another guy who tried to help us do exercises
Figure 2: Chapter 2 of Kauffman’s Knots and Physics
Figure 3, 4: Functional analysis 2 theorem, notes from class


23.09.20
It’s been four score and twenty years since I last posted and promised to post daily.. And like 3 days since I tried to post but my wifi fucked me over and the post got deleted
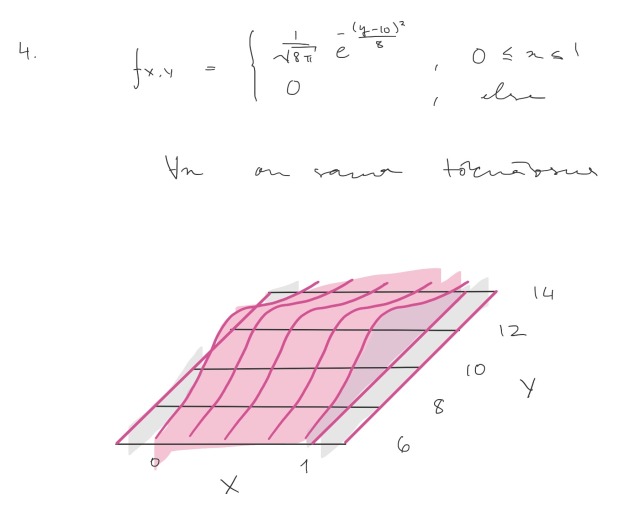
Fig 1. From stats and probability theory 2
Fig 2. Optimal control theory notes
Fig 3. Measure theory from my probability theory 2 class
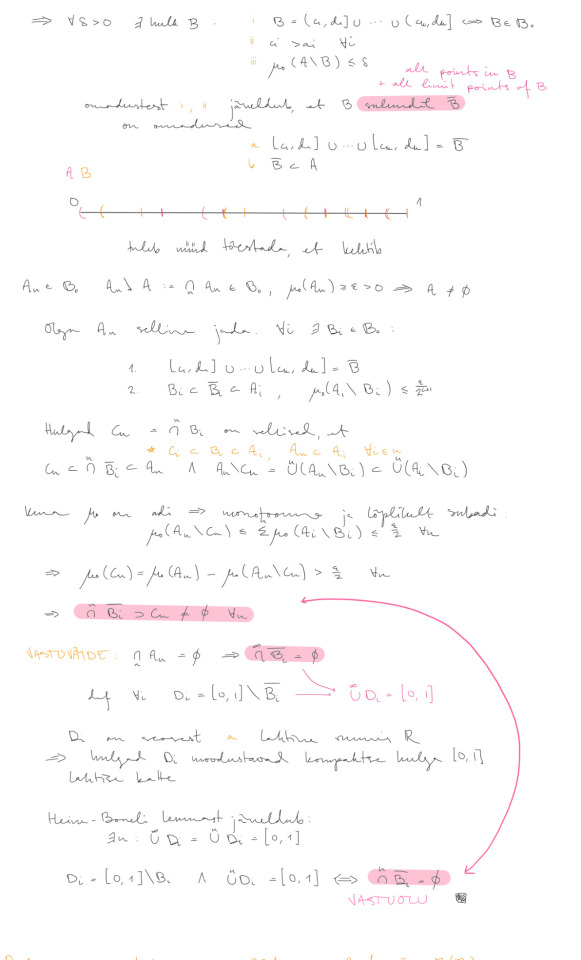
Fig 4. Functional analysis 2
It was decided today that in 3 weeks I’ll do a seminar about knots to the two others being supervised by my supervisor. I know nothing about knots as of now, so I’ll have fun reading through Knots and Physics for the first time.


23.09.20
It’s been four score and twenty years since I last posted and promised to post daily.. And like 3 days since I tried to post but my wifi fucked me over and the post got deleted
Fig 1. From stats and probability theory 2
Fig 2. Optimal control theory notes
Fig 3. Measure theory from my probability theory 2 class
Fig 4. Functional analysis 2
It was decided today that in 3 weeks I’ll do a seminar about knots to the two others being supervised by my supervisor. I know nothing about knots as of now, so I’ll have fun reading through Knots and Physics for the first time.


01.09.20
First actual day of masters and I managed to snag myself an instructor!
I’ll definitely be taking optimal leading theory, optimisation, functional analysis 2 (don’t think about the fact that I haven’t taken functional analysis 1), probability theory 2, and probability theory and statistics 2.
Since I’m not sure if there are any classes I should take this semester related to my field (geometry) I’m registered to mathematical models, but it sounds like I’ll be dropping it for the geometry seminar.
Whenever people need to do something that involves a big bunch of data and making graphs/statistics/etc they think of excel. While excel is great if you actually have to analyse the data yourself qualitatively, R is a way better option for everything else. (It’s also possible to write down the data in excel, and then read that data into R where you can do all kinds of weird shit with it, and if necessary, write an output that can be opened in excel).
SO WHAT EVEN IS IT?
R is a programming language, very similar to python, that is meant for statistics and data analysis: the making of graphs and the manipulation of data is made as easy as possible while still retaining normal programming functionality (whatever the fuck I mean by that).
WHAT R IS NOT GOOD FOR: R is made for statistics, not symbolic math, which should be left to Python (SymPy, NumPy).
WHAT YOU CAN DO WITH R: make animated graphs, filter and manipulate data, write a program that opens a file, does things, and then writes a new file based on those things, use on your CV.
HOW DO I GET THIS “R”?InstallRstudioandR.
OK I’VE OPENED UP RSTUDIO BUT NOW WHAT? There are a lot of good guidesandresourcesfor R, even the official pdf, but here’s some basic stuff for an intro cause I know we don’t always wanna immediately get into a tutorial.
Defining a variable is done using < - (no space, tumblr makes it into an actual arrow for some reason).
A list (not a programming list, a normal list) is called a vector in R. A vector of the colours red, black, and white is defined:

The data type that is most useful is a data frame. A data frame with columns a: 1,2,3,4 (can be shortened to 1:4, where : represent the word ‘to’) and b: 0,1,1,1 would be defined like this:

Loops work the same as usual, but the most useful loop in R (at least in my experience) is the for loop, since you can go through each iteration in a vector (the column of a data frame or the row of a data frame can be treated as a vector). Here’s an example in which i make it print each value for the a column from the previous data frame because i cant think of anything cooler:

Hopefully this makes sense to people who ain’t me. In part 2 I describe how to make plots and what filters are.


All other tags are left as an exercise to the reader.
Thanks ani and @sadcypher for helping me with this!


After a lot of thought I finally decided on math for my masters studies: I’m just not as good at physics as I am at math and I’d like to do better in masters than I did in bachelors. If my field of interest had been more physical I would’ve gone into physics anyway but theoretical physics has a lot to gain from a background in math.
While waiting to get immatriculated again I’ve continued work, slowly, on internship 1 and I’ve decided to learn Japanese again. Hopefully I won’t drop it yet again.
Yes the weird beast thing says I wanna eat Japanese, my vocabulary isn’t very large and I wanted to write SOMETHING next to it.

I successfully defended my thesis and got a ((high)) B (the girls got As and me and the boys got Bs), can’t wait to see the prophesied bloodshed tomorrow when the other half of my course defends.
My course started out with 60ish people for chem phy and matsci all together. Out of that 20 left after the first 1-2 semesters, and the people who are graduating on time rn are 11 physicists, 0 materials scientists, and idk probably like 10 chemists.
Sadly, even though I finished my bachelor’s stuff I gotta write 6 lab reports for optics cause unlike basically every other university mine waited until less than 10 people were allowed in a room together with masks so we could speedrun the labs themselves. I get that we gotta get acquainted with the equipment but still I want to not do anything for a bit reeeee

· December · 2020 ·
My math notes always look so messy, haha… I envy everyone with nice handwriting.
thihe
Post link

· November · 2020 ·
We did some repetion in the last class :)
✨ thihe

· November · 2020 ·
I dont think that I ever practices this much maths in my free time… its kinda fun, but some problems are still confusing :,)
✨thihe


