YouGov poll shows what people assume vs reality. Most of what folks assume is the result of the relentless propaganda of the Left and media.
Ironically, this makes these groups look like less of a minority than they actually are, so they seem less “oppressed”.
Okay, if you have a brain that operates on any modicum of real world understanding, the above comments probably look like gibberish because you probably thought everyone knew “the left” as the side always famously emphasizing that minority groups are, you know, minorities, and that this is the very reason we expect anyone to care about the issues they face.
In fact, it’s pretty common even among “the right” to be angry at “the left” for implying a majority group has inherent privilege, so if ANYONE would want to trick people into over-estimating the population size of these groups, almost anyone would conclude it’s the hardcore conservatives.
So what the HELL are you witnessing here? It’s probably important to explain because not everybody realizes the prevalence of this particular cognitive difference:
Many people, such as @shaughan up there, tend to at least subconsciously base their concern for other people more on an evaluation of their “usefulness” rather than sympathy alone, so in their world, the struggles of a given group matter *less* the smaller that group is. and importantly, they assume by default that this is true of you, too, even if you don’t admit to it.
As a consequence, guys like him believe that “the left” would be the ones who want to artificially inflate the size of a given “interest group” in order to trick people INTO caring about them. Remember, small = unimportant in his world view and he presumes this is the same logic everyone else runs on.
So he sees evidence that minority groups are smaller than everyone thinks, and his reaction isn’t the normal human one. It isn’t “wow, maybe they really are oppressed.” Instead his reaction is “aha! There’s fewer of them than I thought! They don’t matter after all, just as I suspected, and just as dirty liberals were trying to HIDE from me!!!”
If this sounds bizarro world clownshit deranged, that’s because it is, and it’s the same reason they scoff at the idea of protecting people from a deadly virus if it’s “”“only”“” deadly to one in a hundred.
It’s such an unexplainably backwards and twisted way of viewing things, you can see how even siryouremocked, who considers himself merely libertarian rather than far right, understands that a smaller population would be a more vulnerable one people might have more reason to sympathize with, but just didn’t finish turning those cogs far enough to realize he’s replying to someone who was trying to make exactly the opposite point.
I am still learning how to write polls and survey questions that bias the answers as little as possible. I probably get it wrong a lot. But I like to think that I sometimes do a little better than I used to. (This is in large part down to feedback and criticism, and that’s why I am always careful to include a feedback box at the end of the annual survey and any other non-Twitter surveys I run. I’m so grateful for any feedback!)
And this evening, I found a poll that was so… nonsensical, that I had to ramble about it on Twitter. Maybe if I staple it all together into a coherent blog post it might be a useful reference.
I found this on strawpoll.me after voting in a poll about Pokémon Go. It was called “promoted”, presumably meaning someone has paid to have this poll shown when people vote in other unrelated polls.
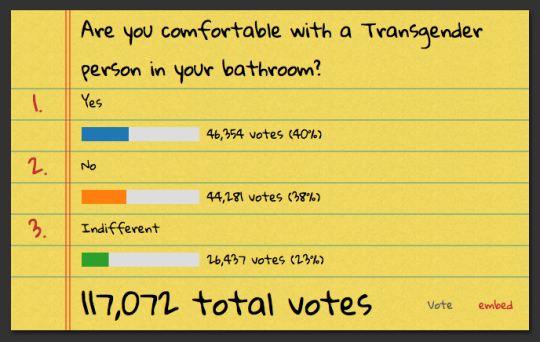
[Image description: A poll question. “Are you comfortable with a Transgender person in your bathroom?” Followed by three answers, “yes (40%)”, “no (38%)”, “indifferent (23%)”. It notes that there are 117,072 total votes.]
At first glance it looks like a fairly straightforward poll about a current topic - the issue of trans people and which public toilets we should be using. Should we use the gendered toilet that matches our gender, our presentation, or our birth certificate? And the results are close - only 2% difference between the trans supporters and the transphobes.
Let’s break this down into all the levels of flawed.
~
IT’S AMBIGUOUSLY WORDED
It’s easy to assume that it means “are you comfortable with a transgender person whose gender matches yours using the same gendered public toilet as you?”
This is not what it says.
It doesn’t specify whether the trans person who’s sharing a toilet with you has a gender that matches your own, and it doesn’t specify that the bathroom is gendered or public.
It’sactually asking whether trans people should be able to use toilets. Because it can be interpreted in so many different ways, the results are meaningless. Here are just a few of the interpretations:
“You’re a trans person. Are you comfortable using the same toilet as other trans people?”
“You’re a person. Are you comfortable using the same gendered public toilet as a trans person whose assigned gender on their birth certificate matches yours, even though they may pass as a different gender to your own (eg: you’re a man and there’s a passing trans woman in your toilet)?”
“You’re a person. Are you comfortable with any trans people in the same public restroom as you?”
“You’re a person. Are you comfortable with your trans friends using your toilet in your home?”
“You’re trans. Are you comfortable in your own bathroom?”
“You’re a person. Are you scared of getting trans germs from sitting on a toilet seat that a trans person has sat on?”
~
IT USES LEADING LANGUAGE
The question is decidedly not neutral. It puts the judgement in the question, establishing it in people’s minds before they read the answer options.
A better way might be to ask, “how do you feel about [issue]?” And the answer options can contain the judgements: “Comfortable, uncomfortable, don’t know.”
It also uses the word “your”, evoking a feeling of territory. It doesn’t imply that you and the trans people have equal right to the toilet, by saying that you share it. It says “this is your toilet, you have a right to it, and someone is allowing a trans person to use it too.” I can see that this could sway someone who’s uncomfortable around trans people into a stronger feeling of being violated by a trans person entering their space.
~
IT ASSUMES THE TARGET IS CIS
I’m trans. I use a bathroom on occasion. I’m comfortable with that.
But I don’t think they’re asking me. I think they’re asking cis people. I think it hasn’t even occurred to the writer that trans people might want to have a voice here. It reflects so clearly that the people debating this issue are not considering the humanity of trans people at all.
~
IT SPLITS THE “YES” VOTE
The options are:
Yes, I’m comfortable (40%)
No, I’m not comfortable (38%)
I’m indifferent - I don’t mind (23%)
I think the writer doesn’t even realise what they’ve done. They’ve tried to present a neutral option, a non-answer, with “indifferent”. What they don’t understand is that these options are not positive-negative-neutral, as they intended. Being “comfortable” is the neutral option. If you don’t mind, you’re not uncomfortable, therefore you are comfortable.
To split the yes vote is to hugely skew the appearance of the results. If you acknowledge that comfortable and indifferent are the same, people who are comfortable/neutral are 62% - nearly two thirds. This is a HUGE difference.
A true positive-negative-neutral set would include comfortable/neutral, uncomfortable/negative, and a positive: being actively happy about the presence of trans people in your bathroom! Like so:
How do you feel about sharing a gendered public restroom with a trans person whose gender identity matches your own?
I love it!
I’m uncomfortable
I don’t mind - the same as I feel about sharing with cis people
~
IT CAPITALISES TRANSGENDER FOR SOME REASON
When people use a capital letter at the start of a noun, it denotes some significance. It indicates that this group of people is special in some way.
Sometimes it expresses respect, like with names of people or places or cultures. This is especially true if the group of people have asserted that their noun should be capitalised, as with the Deaf community.
When the capital letter hasn’t been claimed by the group, it can feel like that group is being made special. Trans people have long been fetishised and alienated, and the capital letter stings a little bit because I think it’s fair to say that most of us just want to be seen as normal, be given the rights and respect and dignity that we deserve as humans, and be left to get on with our lives, instead of having, oh I don’t know, cis people debating our right to basic bodily functions. For example.
In this case, the capital T is condescending, fetishising, and alienating.
Of course, it might be an honest mistake. And if there were any other typos, I might be willing to give it the benefit of the doubt. But there are no other mistakes, and this poll was promoted, someone paid money for this poll to be shown to thousands of people. The typo slipped through the pre-payment spellchecking that even a casual pollgeek would have done when laying some cash on the table. I’m not saying it was deliberate, but there’s more at play here than a complete accident.
~
In conclusion, this poll is basically meaningless. There’s no way of knowing which question anyone’s answering, it assumes trans people are completely powerless and detached, it gives cis readers all the power, and it alienates the trans readers. The answer options themselves make it look like the issue is controversial, when actually there is a clear majority support for trans people being able to use restrooms.
So when you see polls like this, before you make judgements based on the answers, it can be good to think it through.
Unicorn March is all about pride for the most forgotten and endangered parts of the community.
Sometimes, pride means knowing more about the struggles that people like you face. Pride from within, from knowing what you’re surviving. Pride from other community members and outsiders, supporting you and loving you for what you are, not just what you overcome.
This infographic collects all the current data on ace-spec oppression into one thread. (It exceeds Tumblr’s image limit, so if you’re only seeing the first post, check the notes for the rest.) Feel free to save any of these images to share. Tag @unicorn-march if you can, when you use these in a reply or your own posts; it would be great to see how this info helps people. Image descriptions are in the alt tags.
Links to all the sources, in the order that they appear:
The Williams Institute. (2016) LGB Within the T. This paper crunches the data from the 2011 National Transgender Discrimination Survey, which did in-depth interviews of 6,450 trans people of all orientations.
Bauer et al (2018). The 2016 Asexual Community Survey Summary Report. This is an ongoing annual online survey of major asexual communities; the 2016 survey received a total of 9,869 responses (Ace = 9331 and Non-Ace= 538). As it’s not a peer-reviewed published study, it’s used even more sparingly here; the only data used here from this report is the percentage of cis aces who had considered suicide.
fun fact: these notes are from november, i took the photo in december, and now you’re seeing it in january :) the wonders of procrastination and photo scheduling! ⠀⠀⠀⠀⠀⠀⠀ posted on Instagram - https://ift.tt/38adxwr
Good morning folks, and welcome to today’s statistical map - it’s about something I’ve tracked here for ten years, and about which I am passionate: linguistic diversity (or lack thereof) at Eurovision. ESC was envisioned not just as a peace project but as a showcase of European cultural diversity, and so I personally find the prospect of an almost entirely anglophone contest to be a concerning one.
In 2013, 17 countries out of 39 - some 44% - sang entirely or almost entirely not in English, but it’s a proportion we have seldom come close to since. In the following three years, no doubt partially because so many of the non-English entries did not qualify, we saw annual reductions to a historic nadir of only 15% non-English songs in 2016. We got a modest 1% bump after Jamala’s victory, and a major jump to 33% after Salvador - but in 2019-20, after two English language winners, the number went back down to 22%.
This year, the proportion is slightly lower yet - only 21% of songs have no or next to no English lyrical content, whilst 69% of songs have no or negligible (think individual words like in San Marino or Cyprus) non-English content, which is higher than even last year, and the highest since 2016. With even Portugal,who had never before sung entirely in English, breaking that streak, all bets seem to be off the table as to which countries will sing in their native language outside of Serbia, Albania and the Romance-speaking trio inside the Big 5.
That being said, it’s not all doom and gloom this year - we’re getting a prominent language début in the form of Jeangu’s Sranan Tongo choruses, which is also the first time NL sends a song with some non-English content since 2010. The miniature Eastern Slavic language revival continues, with Go_A once again sending a song in Ukrainian and Russia sending their first song mostly in Russian since 2009. Denmarksent their first song entirely in Danish since 1997. Switzerland’sGjon’s tears once again opted for French, and his will be the first francophone song performed from Switzerland since 2010. With France, who have only their 2nd entirely French language song since 2016, also perched at the top of the bookies’ odds, the possibility for an influential non-English win is not negligible.
We also get to hear a little Azeri for the first time ever; a little Czech for the first time since Czechia’s début in 2007; a little Germanfor the first time since the same year. I really hope for a year of success for songs in other languages so that delegations are encouraged to not just use their native languages as a spice to be sprinkled very sparingly over songs, but rather to send songs almost entirely in them in the near future.
Many “gender critical” people on this website like to site a 2011 Swedish study to claim that trans women have the same rates of violence as cisgender men. This claim is a gross misreading and should be challenged whenever seen. Below I will be showing quotes from one of the researchers from the study showing exactly how wrong the “gender critical” claim is.
For starters the study found that women who transitioned from 1989-2003 did not even demonstrate a male pattern of criminality let alone anything close to the same pattern of violence. Which means that the claim of trans women being as violent as cisgender men is definitely false as a general statement for all the women who transitioned from 1989 onward.
The study as a whole covers the period between 1973 and 2003. If one divides the cohort into two groups, 1973 to 1988 and 1989 to 2003, one observes that for the latter group (1989 – 2003), differences in mortality, suicide attempts and crime disappear. This means that for the 1989 to 2003 group, we did not find a male pattern of criminality.
However we also need to look at another key distortion of the facts that the “gender critical” camp manufactured. Pattern of Criminality does not mean the same thing as pattern of violence. Even the trans women in the 1973-1988 group were not shown to exhibit the same rates of violence that cisgender men do. What the study actually does show is that prior to 1989 trans women were being convicted at the same rate as cisgender men, not for the same crimes.
As to the criminality metric itself, we were measuring and comparing the total number of convictions, not conviction type. We were not saying that cisgender males are convicted of crimes associated with marginalization and poverty. We didn’t control for that and we were certainly not saying that we found that trans women were a rape risk.
The idea that trans women are just as likely to rape as cis men is a lie. It is a lie which has become a central tenet of denying trans women access to life saving shelter and community and this lie needs to be confronted where ever it tries to take root. Whenever you see this lie, shine a light on it because it can only grow in the dark.
I’d like to point out that actual studies have linked trans suicides to constant misgendering as a cause (one of, I should add), whereas affirmation of gender is known to do the opposite. So intentionally misgendering trans people is pretty much legit trying to kill them.
In other news, water is wet.
Where the study/source?
I’m uber busy at work and I don’t have the time to pull up the specific spot it’s discussed. But, look up the work of Dr. Ry Testa. He’s a trans man tackling these issues.
Someone who knows how to navigate resources and has the spoons and time try and find the paper, save trans momma the trouble.
Sounds super legit though. Being misgendered almost always causes some dissociation and social withdrawal form me since it belittles my identity. I don’t get suicidal thoughts but I could sure as hell see how someone who does would be affected by that.
Misgendering a trans person is a violent act. It’s an emotional abuse that cuts deep into who we feel we are at our core. We have enough to deal with internally, adding external voices to that can destroy us.
GBV was associated with both a history of suicide attempts and numbers of suicide attempts in this study. Participants who had been exposed to victimization were almost four times more likely to attempt suicide than those who had not experienced victimization. In addition, over three-quarters of those who had a history of suicide attempt had attempted multiple times. Trans men exposed to GBV were 2.1 times more likely than trans women to have a history of a single suicide attempt and were 3.2 times as likely to have made multiple suicide attempts. A history of suicide attempts was significantly more common among multiracial individuals, and significantly less common among those of higher SES.
From the last article linked to.
Even more relevant is actually The Gender Minority Stress and Resilience Measure article…
In addition to the violence, rejection, and discrimination experienced by both LGB and TGNC people, TGNC individuals may experience an additional distal stressor, which this study has labeled nonaffirmation. Nonaffirmation occurs when one’s internal sense of gender identity is not affirmed by others. For instance, a trans woman may be addressed as “sir” when making a purchase or answering the phone, or might be referred to with her former male name by an individual not yet fully comfortable with her gender identity. TGNC individuals who do not identify as either male or female (e.g., individuals who identify as genderqueer) may also experience a sense of nonaffirmation as people in their life are unable to refer to them in gender neutral ways. Nonaffirmation of one’s gender identity may occur more or less often for any TGNC individual, based on how their gender expression is interpreted by their social context at that particular time (Beemyn & Rankin, 2011; Bockting & Coleman, 2007; Nuttbrock, Rosenblum, & Blumenstein, 2002). In sum, the literature suggests that TGNC and LGB populations experience both common and also unique distal minority stressors.
It also cites these works in relation to the concept:
Beemyn, G., & Rankin, S. R. (2011). The lives of transgender people. New York, NY: Columbia University Press.
Grant, J. M., Mottet, L. A., Tanis, J., Herman, J. L., Harrison, J., & Keisling, M. (2010). National Transgender Discrimination Survey. Report on health and health care (pp. 1–23). Washington, DC: National Center for Transgender Equality and National Gay and Lesbian Task Force.
Hey, thanks. I haven’t had a good mental headspace for reading recently, so this is helpful.


![[Dark purple background with large white text that says 'Unicorn March presents: What Aces Face,' followed by a small ace flag.]](https://64.media.tumblr.com/b299ab08ac40f0706ae9ef8fc5d6a404/3a248b3cb03605cb-59/s540x810/db2dd515bef1c57ae5bbac1ea13b817c60ac0804.png)
![[Dark purple background with large white text that says 'First, a few quick definitions.' Smaller white text below it says, 'The 'unicorns' of the LGBTQIPA+ community are groups that are rarely seen, and rarely supported. Asexuals, or 'aces,' aren't sexually attracted to men. Or women. Or any other genders. Some aces can get turned on by the idea of enjoyable sex; some just don't enjoy it, or are repulsed by it. But they don't get turned on by people. The ace spectrum also includes people who are demisexual and grey-ace. Demis don't experience sexual attraction without deep emotional intimacy. Most people go on first dates to see if they feel attraction; demis don't know if they'll ever feel it for a given person.']](https://64.media.tumblr.com/a403a10ecdf86296c292986911491320/3a248b3cb03605cb-2a/s540x810/9d3e987953ca8ccc1d90476c8aa5809abd0177de.png)
![[White text here continues from the previous image: 'Like many grey areas, 'grey-ace' covers a lot of territory. Grey-aces identify with the experiences shared overall by the ace community. But they might feel unsure about whether they sometimes experience sexual attraction. They may experience it only vaguely, conditionally, or, like many demis, very, very rarely. Or they may experience some sort of sexual attraction, but not any particular drive or interest in sex. The beauty of the grey-ace label is that people can connect to the ace-spec community without having to put their reasons into words. If that sounds confusing, try assuming you're experiencing attraction, when really you just want, very much, to date someone. Or thinking you must be bi or pan, because you experience the same amount of (or lack of) attraction to all genders. Or distinguishing between sexual attraction to people, and free-floating sexual arousal in general. Most of us assume that if we have any sex drive at all, it must mean we're attracted to people. But there's a difference... and even when we don't notice the difference, it has an impact on our lives.']](https://64.media.tumblr.com/6923e1c64acf73d7297ccb5ca2d90b21/3a248b3cb03605cb-10/s540x810/695d3172f0037b654892192c5744ccd55209f607.png)
![[Black text on a grey background says In The WorkplACE. The letters ACE are in the rest of the ace pride flag colors: white, grey, and purple. Below this header is an explanation of the bar graph following it: 'The white columns show the percent of each group, at work, that experiences verbal harassment, exclusion from activities, being nonconsensually outed, the threat or act of physical or sexual harassment or violence, or other inappropriate comments or conduct. In order to avoid counting sexual minorities who are harassed for being trans, these numbers are only for cis sexual minorities. Transgender responses were consistently higher: a full third of heterosexual trans people reported similar experiences.' The chart shows that 19.3% of gay people were harassed at work, 23.3% of bisexuals, 28.6% of pansexuals, 29% of aces, and 27.1% of queer people. Additional dark and light purple bars alongside the white bars show stats for cis and trans people living in poverty. Among cis people, 37.7% of gay people in the UK are living in poverty; 59% of bisexuals; 65.2% of pansexuals; 64% of aces; and 57.3% of queer people. Among trans people, 57.9% of gay people live in poverty; 60.5% of bisexuals; 66.2% of pansexuals; 64.8% of aces; and 64.7% of queer people. Black text below this chart gives the source of the data as 'Government Equalities Office, 2017, National LGBT Survey.']](https://64.media.tumblr.com/f6dafec3a32d0792d6972309bac6e820/3a248b3cb03605cb-b8/s540x810/300f9969ec625fa78b49525e7ad1a0892e855bba.png)
![[This page features a purple background and a central white square with the text, 'Barriers To Education: In 2015, the Association of American Universities surveyed more than 150,000 students nationwide about some of the challenges they might have been experiencing. These statistics are from their time in college and graduate school only.' Around this are four sections, with greyscale squares in different sizes showing the statistics for each group. From the top of the page, proceeding clockwise around it: 60.4% of gay/lesbians, 64% of aces, and 69.1% of bisexuals experience harassment during college and graduate school. 10.8% of straight students, 13.7% of gay/lesbian, 18.3% of ace, and 25.6% of bi students experience violent assault. 3.7% of straight, 5.9% of gay, 9.5% of ace, and 9.9% of bi students experience stalking. and 5.2% of straight, 8.7% of gay, 13.5% of ace, and 14.4% of bi students experience nonconsensual touch. The bottom of the page gives the following source: Cantor, David, et al. 2015. AAU Climate Survey on Sexual Assault and Sexual Misconduct.]](https://64.media.tumblr.com/614860c9b928478aa751de18582f0c85/3a248b3cb03605cb-8c/s540x810/d0312046aa67bb4a9494062888d66d6b64cddafd.png)
![[A light grey background, decorated with dots and circles in purple and white, with a white bar graph. Purple text reads, 'HOME SWEET HOME: The white columns show the percent of each group that at home, in the past year, experienced verbal harassment, insults, or other hurtful comments; coercive or controlling behavior; being nonconsensually outed; the threat or act of physical or sexual harassment or violence; or other inappropriate comments or conduct. In order to avoid counting sexual minorities who are abused for being trans, these numbers are only for cis sexual minorities. Transgender responses were consistently higher, but followed a similar pattern, ranging from 36.8% for heterosexuals to 58.9% for pansexuals.' Below this, the bar chart shows the percentages: 22.5% of gay people, 34.8% of bisexuals, 39.3% of pansexuals, 32.1% of queer people, 35.6% of aces, and 36.6% of people identifying in some other way. These stats are once again from the UK's national LGBT Survey in 2017.]](https://64.media.tumblr.com/c9bff5a3836fd8461023a7d57c908cbe/3a248b3cb03605cb-55/s540x810/0a6b941669c70ee639a27cac6ba47dab621075cc.png)
![[A large, purple-edged, white speech bubble against a black background says, 'So-called conversion therapies, sometimes also referred to as cure, aversion or reparative therapies, are techniques intended to change someone’s sexual orientation or gender identity... commonly ranging from pseudo-psychological treatments to spiritual counselling. In extreme cases, they may also include surgical and hormonal interventions, or so-called ‘corrective’ rape.' The quote is attributed to 'The Rt. Hon. Penny Mordaunt and the Government Equalities Office. (2017) National LGBT Survey: Research Report.']](https://64.media.tumblr.com/4d4a835706fbb8e026d6c73d9d8f2501/3a248b3cb03605cb-5e/s540x810/6333fbcadc8d9c239c4d46d57fcf897447468aad.png)
![[A cherry-red megaphone against a purple background illustrates the stats for 'CONVERSION THERAPY.' A smaller subheader says, 'The least- studied asexual experience by far is also one of the most damaging -- and most common.' The page goes on to explain, 'In 2017, the UK's Government Equalities Office conducted the National LGBT Survey, which included more than 108,000 LGBTQIPA+ people. Their findings finally validated what aces had been saying for years: a wide swath of the world treats their sexual orientation as a disease to be 'cured.' By force, if necessary.' The megaphone is lined with bold black statistics: Bi, 5.2%. Pan, 6.6%. Gay, 7.6%. Ace, 10.2%. At the bottom, a smaller note says that 'Percentages are of cis people who have had, or been directed to, conversion therapy for their orientation. Trans responses are omitted here for clarity, as they could have been targeted for gender, orientation, or both.']](https://64.media.tumblr.com/bfcaf8680bc24d8be2fbc089453d0c59/3a248b3cb03605cb-89/s540x810/8eb05239120a9db69e37de31e16a607c2edea8de.png)
![[White text on a black background says, 'HOMELESSNESS IS NOT AN EVENT: '...For LGBTQA youth, while disclosures of stigmatized sexual or gender identities typically did not instantly result in getting kicked out, it often arrived in the context of already stressed parent-child relationships and other parental and family struggles that were years in the making. 'Many of these youth eventually left in order to escape the stigma and discrimination they had endured within their families for quite some time. [They reported] some of the highest rates of adversity scores in our survey, often while stably housed.' Samuels, Gina E. Miranda, et al. (2019) Voices of Youth Count In-Depth Interviews: Technical Report.]](https://64.media.tumblr.com/c435bb7d5ec7627313d18a080be06960/e1a0de38c01b1afa-73/s540x810/64266ef0a5ea43eb36c28ebe99ef26a839bb4df4.png)
![[White text on a purple background says, 'HOMELESSNESS: A higher likelihood of becoming homeless is one of the most socially visible effects of oppression. According to the national 2016-17 Voices Of Youth Count survey, 114% more homeless youth are on the ace spectrum than youth in the general population. 41% more are gay/lesbian; 50% more are bi; and 83% more are trans.' Below that, a grey bar chart on a white background shows these statistics, as well as showing that cis hetero youth are disproportionately less likely to become homeless.' Source: Chapin Hall at the University of Chicago. (2017) Youth Homelessness in San Diego County, California: Findings from the youth count, brief youth survey, and provider survey.]](https://64.media.tumblr.com/35d414ba931da4f566224c613619f51d/e1a0de38c01b1afa-1f/s540x810/86733d985bc84a975cb7d4223a1a463b4f3c023d.png)
![[White text on a purple background says, 'In 2011, the National Transgender Discrimination Survey spoke with 6,450 trans people, creating a detailed portrait of transgender life. We all know the trans community struggles with very high homelessness rates. So high that even heterosexual trans people have the same likelihood of having been homeless at some point as their gay and bi transgender peers: around 19%. But if you're trans and ace? 27%.' Source: 'LGB Within the T,' The Williams Institute A grey bar chart on the right, against a white background, illustrates the statistics: 19% each for straight and gay trans people, 17% for bi trans people, and 27% for ace trans people.]](https://64.media.tumblr.com/db83d75b585d3e8edba444c0dd78abe1/e1a0de38c01b1afa-22/s540x810/95f3f4ff57966f61bd104cbba82cda8f21ab32a3.png)
![[Large white text on a black background says, 'If asexual people feel similar pressure to other sexual minorities to conform to heterosexual norms, then it is possible that they too may have elevated rates of mental health problems.' From Morag A. Yulea, Lori A. Brottob and Boris B. Gorzalkaa's 2011 paper, 'Mental Health and Interpersonal Functioning in Self-Identified Asexual Men and Women.']](https://64.media.tumblr.com/3171c7159d0623cfe041798fbfab519f/e1a0de38c01b1afa-b3/s540x810/6a94dd192d15145ae0fd8e85320e8ab776bb7d2c.png)
![[The header says, 'MENTAL HEALTH PROBLEMS: These are each group's mean scores on clinical assessments for depression and generalized anxiety disorder. GAD is diagnosed at scores of 10 or higher. Scores of 10-14 on the PHQ-9 indicate moderate depression.' Below this are greyscale stripes going from off-white to black. Each stripe has the name of a sexual orientation, followed by two emoji illustrating their average scores for clinical depression and anxiety disorders. Heterosexuals are illustrated with two smiley faces and the scores 6.15 anxiety, 6.99 depression. Gay Men and Lesbians have upside-down smiley faces, in the classic 'ha ha I'm screwed' emoji, and the scores 7.50 anxiety, 8.83 depression. The other four orientations have sad faces, illustrating scores approaching or above the clinical cutoff for these mood disorders: Bisexuals, 9.92 anxiety, 10.73 depression. Asexuals, 9.24 anxiety, 11.80 depression. Pansexuals, 10.13 anxiety, 12.37 depression. And demisexuals, 11.56 anxiety, 13.47 depression. A purple circle on the right contains the text 'Source: Borgogna, N. C., et al. 2018. Anxiety and Depression Across Gender and Sexual Minorities: Implications for Transgender, Gender Nonconforming, Pansexual, Demisexual, Asexual, Queer, and Questioning Individuals.']](https://64.media.tumblr.com/b8678cc090567d1b203f96f5b87420e5/e1a0de38c01b1afa-59/s540x810/b7adc310a0ba30504674f899c05b758296acca5a.png)
![[A black header against a broad purple background says, 'SUICIDALITY'. Below, in large white text, the number '26% of cis aces' stands out. It continues in smaller text, 'in a 2011 study had suicidal thoughts/feelings in the two weeks prior to the study, compared to 24% of cis LGB and 12% of cis straight subjects.' Source: 'Mental Health and Interpersonal Functioning in Self-Identified Asexual Men and Women,' Yulea, Brotto, & Gorzalska, 2011.]](https://64.media.tumblr.com/5e21684f66d0e7c811764665c60bdf80/e1a0de38c01b1afa-15/s540x810/e0dfca294d31ed1ce7a6d50de8dd1121606bca45.png)
![[White text on a gray background says, 'Have you ever seriously considered suicide? 11% of cis straight people have thought about it at some point in their lives. So have 34% of cis gay and lesbian people, and 38% of cis bisexuals. 'In the cis ace community, that number jumps to 43.4%.' A purple bar graph to the right illustrates these numbers. Sources: Salway et al (2019). A Systematic Review and Meta‑Analysis of Disparities in the Prevalence of Suicide Ideation and Attempts Among Bisexual Populations, and Bauer et al (2016). The 2016 Asexual Community Survey Summary Report.]](https://64.media.tumblr.com/e9502a46142b8d34bb4e4fefc189ab79/e1a0de38c01b1afa-f4/s540x810/91d65df7b540d17019e1c5944c540d4214db9583.png)
![[White text on a black background says, 'Asexual trans people have the highest rate of attempted suicide of all sexual orientations: a shocking 46%.' The number 46% is in large italic purple text. Smaller white italics continue, 'Remember, that statistic only measures those who attempted it. In one study of nearly 2,000 trans people aged 14-30, 95.5% of subjects reported having had suicidal thoughts and feelings at some point in their lives.' A purple bar chart to the right illustrates the statistics: 36% of hetero trans people, 40% of gay/lesbian trans people, 40% of bi+ trans people, and 46% of aces.' Sources: Grant, Jaime M. et al (2011). Injustice at every turn: A report of the National Transgender Discrimination Survey; and Kuper et al (2018). Exploring Cross-Sectional Predictors of Suicide Ideation, Attempt, and Risk in a Large Online Sample of Transgender and Gender Nonconforming Youth and Young Adults.]](https://64.media.tumblr.com/458e664c74511ba2ab97d4a5d3a7f530/e1a0de38c01b1afa-82/s540x810/0e978572e4734ce5f76806488d1451fa12edb3bb.png)


 more peachy notes, featuring the rose gold uni jetstream pen! ⠀⠀⠀⠀⠀⠀⠀")


