Classic Bookshelf: This site has put classic novels online, from Charles Dickens to Charlotte Bronte.
The Online Books Page: The University of Pennsylvania hosts this book search and database.
Project Gutenberg: This famous site has over 27,000 free books online.
Page by Page Books: Find books by Sir Arthur Conan Doyle and H.G. Wells, as well as speeches from George W. Bush on this site.
Classic Book Library: Genres here include historical fiction, history, science fiction, mystery, romance and children’s literature, but they’re all classics.
Classic Reader: Here you can read Shakespeare, young adult fiction and more.
Read Print: From George Orwell to Alexandre Dumas to George Eliot to Charles Darwin, this online library is stocked with the best classics.
Planet eBook: Download free classic literature titles here, from Dostoevsky to D.H. Lawrence to Joseph Conrad.
The Spectator Project: Montclair State University’s project features full-text, online versions of The Spectator and The Tatler.
Bibliomania: This site has more than 2,000 classic texts, plus study guides and reference books.
Online Library of Literature: Find full and unabridged texts of classic literature, including the Bronte sisters, Mark Twain and more.
Bartleby: Bartleby has much more than just the classics, but its collection of anthologies and other important novels made it famous.
Fiction.us: Fiction.us has a huge selection of novels, including works by Lewis Carroll, Willa Cather, Sherwood Anderson, Flaubert, George Eliot, F. Scott Fitzgerald and others.
Free Classic Literature: Find British authors like Shakespeare and Sir Arthur Conan Doyle, plus other authors like Jules Verne, Mark Twain, and more.
TEXTBOOKS
Textbook Revolution: Find biology, business, engineering, mathematics and world history textbooks here.
Wikibooks: From cookbooks to the computing department, find instructional and educational materials here.
Italian Women Writers: This site provides information about Italian women authors and features full-text titles too.
Biblioteca Valenciana: Register to use this database of Catalan and Valencian books.
Ketab Farsi: Access literature and publications in Farsi from this site.
Afghanistan Digital Library: Powered by NYU, the Afghanistan Digital Library has works published between 1870 and 1930.
CELT: CELT stands for “the Corpus of Electronic Texts” features important historical literature and documents.
Projekt Gutenberg-DE: This easy-to-use database of German language texts lets you search by genres and author.
HISTORY AND CULTURE
LibriVox: LibriVox has a good selection of historical fiction.
The Perseus Project: Tufts’ Perseus Digital Library features titles from Ancient Rome and Greece, published in English and original languages.
Access Genealogy: Find literature about Native American history, the Scotch-Irish immigration in the 19th and 20th centuries, and more.
Free History Books: This collection features U.S. history books, including works by Paul Jennings, Sarah Morgan Dawson, Josiah Quincy and others.
Most Popular History Books: Free titles include Seven Days and Seven Nights by Alexander Szegedy and Autobiography of a Female Slave by Martha G. Browne.
RARE BOOKS
Questia: Questia has 5,000 books available for free, including rare books and classics.
ARTS AND ENTERTAINMENT
Books-On-Line: This large collection includes movie scripts, newer works, cookbooks and more.
Chest of Books: This site has a wide range of free books, including gardening and cooking books, home improvement books, craft and hobby books, art books and more.
Free e-Books: Find titles related to beauty and fashion, games, health, drama and more.
2020ok: Categories here include art, graphic design, performing arts, ethnic and national, careers, business and a lot more.
Free Art Books: Find artist books and art books in PDF format here.
Free Web design books: OnlineComputerBooks.com directs you to free web design books.
Free Music Books: Find sheet music, lyrics and books about music here.
Free Fashion Books: Costume and fashion books are linked to the Google Books page.
MYSTERY
MysteryNet: Read free short mystery stories on this site.
TopMystery.com: Read books by Edgar Allan Poe, Sir Arthur Conan Doyle, GK Chesterton and other mystery writers here.
Mystery Books: Read books by Sue Grafton and others.
POETRY
The Literature Network: This site features forums, a copy of The King James Bible, and over 3,000 short stories and poems.
Poetry: This list includes “The Raven,” “O Captain! My Captain!” and “The Ballad of Bonnie and Clyde.”
Poem Hunter: Find free poems, lyrics and quotations on this site.
Famous Poetry Online: Read limericks, love poetry, and poems by Robert Browning, Emily Dickinson, John Donne, Lord Byron and others.
Google Poetry: Google Books has a large selection of poetry, fromThe Canterbury Tales to Beowulf to Walt Whitman.
QuotesandPoem.com: Read poems by Maya Angelou, William Blake, Sylvia Plath and more.
CompleteClassics.com: Rudyard Kipling, Allen Ginsberg and Alfred Lord Tennyson are all featured here.
PinkPoem.com: On this site, you can download free poetry ebooks.
MISC
Banned Books: Here you can follow links of banned books to their full text online.
World eBook Library: This monstrous collection includes classics, encyclopedias, children’s books and a lot more.
DailyLit: DailyLit has everything from Moby Dick to the recent phenomenon, Skinny Bitch.
The complete Canvas web codebase has been released under a 3-clause BSD license and uploaded to GitHub. You can find it here: https://github.com/canvasnetworks/canvas
By Akshay Sarma, Principal Engineer, Verizon Media & Brian Xiao, Software Engineer, Verizon Media
This is the first of an ongoing series of blog posts sharing releases and announcements for Bullet, an open-sourced lightweight, scalable, pluggable, multi-tenant query system.
Bullet allows you to query any data flowing through a streaming system without having to store it first through its UI or API. The queries are injected into the running system and have minimal overhead. Running hundreds of queries generally fit into the overhead of just reading the streaming data. Bullet requires running an instance of its backend on your data. This backend runs on common stream processing frameworks (Storm and Spark Streaming currently supported).
The data on which Bullet sits determines what it is used for. For example, our team runs an instance of Bullet on user engagement data (~1M events/sec) to let developers find their own events to validate their code that produces this data. We also use this instance to interactively explore data, throw up quick dashboards to monitor live releases, count unique users, debug issues, and more.
Sinceopen sourcing Bullet in 2017, we’ve been hard at work adding many new features! We’ll highlight some of these here and continue sharing update posts for future releases.
Windowing
Bullet used to operate in a request-response fashion - you would submit a query and wait for the query to meet its termination conditions (usually duration) before receiving results. For short-lived queries, say, a few seconds, this was fine. But as we started fielding more interactive and iterative queries, waiting even a minute for results became too cumbersome.
Enter windowing! Bullet now supports time and record-based windowing. With time windowing, you can break up your query into chunks of time over its duration and retrieve results for each chunk. For example, you can calculate the average of a field, and stream back results every second:
In the above example, the aggregation is operating on all the data since the beginning of the query, but you can also do aggregations on just the windows themselves. This is often called a Tumblingwindow:
With record windowing, you can get the intermediate aggregation for each record that matches your query (a Sliding window). Or you can do a Tumblingwindow on records rather than time. For example, you could get results back every three records:
Overlapping windows in other ways (Hopping windows) or windows that reset based on different criteria (Session windows, Cascading windows) are currently being worked on. Stay tuned!
Apache Pulsar support as a native PubSub
Bullet uses a PubSub (publish-subscribe) message queue to send queries and results between the Web Service and Backend. As with everything else in Bullet, the PubSub is pluggable. You can use your favorite pubsub by implementing a few interfaces if you don’t want to use the ones we provide. Until now, we’ve maintained and supported a REST-based PubSub and an Apache Kafka PubSub. Now we are excited to announce supporting Apache Pulsar as well! Bullet Pulsar will be useful to those users who want to use Pulsar as their underlying messaging service.
If you aren’t familiar with Pulsar, setting up a local standalone is very simple, and by default, any Pulsar topics written to will automatically be created. Setting up an instance of Bullet with Pulsar instead of REST or Kafka is just as easy. You can refer to our documentation for more details.
Plug your data into Bullet without code
While Bullet worked on any data source located in any persistence layer, you still had to implement an interface to connect your data source to the Backend and convert it into a record container format that Bullet understands. For instance, your data might be located in Kafka and be in the Avro format. If you were using Bullet on Storm, you would perhaps write a Storm Spout to read from Kafka, deserialize, and convert the Avro data into the Bullet record format. This was the only interface in Bullet that required our customers to write their own code. Not anymore! Bullet DSL is a text/configuration-based format for users to plug in their data to the Bullet Backend without having to write a single line of code.
Bullet DSL abstracts away the two major components for plugging data into the Bullet Backend. A Connector piece to read from arbitrary data-sources and a Converter piece to convert that read data into the Bullet record container. We currently support and maintain a few of these - Kafka and Pulsar for Connectors and Avro, Maps and arbitrary Java POJOs for Converters. The Converters understand typed data and can even do a bit of minor ETL (Extract, Transform and Load) if you need to change your data around before feeding it into Bullet. As always, the DSL components are pluggable and you can write your own (and contribute it back!) if you need one that we don’t support.
We appreciate your feedback and contributions! Explore Bullet on GitHub, use and help contribute to the project, and chat with us on Google Groups. To get started, try our Quickstarts on SparkorStorm to set up an instance of Bullet on some fake data and play around with it.
By Mohit Goenka, Gnanavel Shanmugam, and Lance Welsh
At Yahoo Mail, we’re constantly striving to upgrade our product experience. We do this not only by adding new features based on our members’ feedback, but also by providing the best technical solutions to power the most engaging experiences. As such, we’ve recently introduced a number of novel and unique revisions to the way in which we use Redux that have resulted in significant stability and performance improvements. Developers may find our methods useful in achieving similar results in their apps.
Improvements to product metrics
Last year Yahoo Mail implemented a brand new architecture using Redux. Since then, we have transformed the overall architecture to reduce latencies in various operations, reduce JavaScript exceptions, and better synchronized states. As a result, the product is much faster and more stable.
Stability improvements:
when checking for new emails – 20%
when reading emails – 30%
when sending emails – 20%
Performance improvements:
10% improvement in page load performance
40% improvement in frame rendering time
We have also reduced API calls by approximately 20%.
How we use Redux in Yahoo Mail
Redux architecture is reliant on one large store that represents the application state. In a Redux cycle, action creators dispatch actions to change the state of the store. React Components then respond to those state changes. We’ve made some modifications on top of this architecture that are atypical in the React-Redux community.
For instance, when fetching data over the network, the traditional methodology is to use Thunk middleware. Yahoo Mail fetches data over the network from our API. Thunks would create an unnecessary and undesirable dependency between the action creators and our API. If and when the API changes, the action creators must then also change. To keep these concerns separate we dispatch the action payload from the action creator to store them in the Redux state for later processing by “action syncers”. Action syncers use the payload information from the store to make requests to the API and process responses. In other words, the action syncers form an API layer by interacting with the store. An additional benefit to keeping the concerns separate is that the API layer can change as the backend changes, thereby preventing such changes from bubbling back up into the action creators and components. This also allowed us to optimize the API calls by batching, deduping, and processing the requests only when the network is available. We applied similar strategies for handling other side effects like route handling and instrumentation. Overall, action syncers helped us to reduce our API calls by ~20% and bring down API errors by 20-30%.
Another change to the normal Redux architecture was made to avoid unnecessary props. The React-Redux community has learned to avoid passing unnecessary props from high-level components through multiple layers down to lower-level components (prop drilling) for rendering. We have introduced action enhancers middleware to avoid passing additional unnecessary props that are purely used when dispatching actions. Action enhancers add data to the action payload so that data does not have to come from the component when dispatching the action. This avoids the component from having to receive that data through props and has improved frame rendering by ~40%. The use of action enhancers also avoids writing utility functions to add commonly-used data to each action from action creators.
In our new architecture, the store reducers accept the dispatched action via action enhancers to update the state. The store then updates the UI, completing the action cycle. Action syncers then initiate the call to the backend APIs to synchronize local changes.
Conclusion
Our novel use of Redux in Yahoo Mail has led to significant user-facing benefits through a more performant application. It has also reduced development cycles for new features due to its simplified architecture. We’re excited to share our work with the community and would love to hear from anyone interested in learning more.
Kuhu Shukla (bottom center) and team at the 2017 DataWorks Summit
By Kuhu Shukla
This post first appeared here on the Apache Software Foundation blog as part of ASF’s “Success at Apache” monthly blog series.
As I sit at my desk on a rather frosty morning with my coffee, looking up new JIRAs from the previous day in the Apache Tez project, I feel rather pleased. The latest community release vote is complete, the bug fixes that we so badly needed are in and the new release that we tested out internally on our many thousand strong cluster is looking good. Today I am looking at a new stack trace from a different Apache project process and it is hard to miss how much of the exceptional code I get to look at every day comes from people all around the globe. A contributor leaves a JIRA comment before he goes on to pick up his kid from soccer practice while someone else wakes up to find that her effort on a bug fix for the past two months has finally come to fruition through a binding +1.
Yahoo – which joined AOL, HuffPost, Tumblr, Engadget, and many more brands to form the Verizon subsidiary Oath last year – has been at the frontier of open source adoption and contribution since before I was in high school. So while I have no historical trajectories to share, I do have a story on how I found myself in an epic journey of migrating all of Yahoo jobs from Apache MapReduce to Apache Tez, a then-new DAG based execution engine.
Oath grid infrastructure is through and through driven by Apache technologies be it storage through HDFS, resource management through YARN, job execution frameworks with Tez and user interface engines such as Hive, Hue, Pig, Sqoop, Spark, Storm. Our grid solution is specifically tailored to Oath’s business-critical data pipeline needs using the polymorphic technologies hosted, developed and maintained by the Apache community.
On the third day of my job at Yahoo in 2015, I received a YouTube link on An Introduction to Apache Tez. I watched it carefully trying to keep up with all the questions I had and recognized a few names from my academic readings of Yarn ACM papers. I continued to ramp up on YARN and HDFS, the foundational Apache technologies Oath heavily contributes to even today. For the first few weeks I spent time picking out my favorite (necessary) mailing lists to subscribe to and getting started on setting up on a pseudo-distributed Hadoop cluster. I continued to find my footing with newbie contributions and being ever more careful with whitespaces in my patches. One thing was clear – Tez was the next big thing for us. By the time I could truly call myself a contributor in the Hadoop community nearly 80-90% of the Yahoo jobs were now running with Tez. But just like hiking up the Grand Canyon, the last 20% is where all the pain was. Being a part of the solution to this challenge was a happy prospect and thankfully contributing to Tez became a goal in my next quarter.
The next sprint planning meeting ended with me getting my first major Tez assignment – progress reporting. The progress reporting in Tez was non-existent – “Just needs an API fix,” I thought. Like almost all bugs in this ecosystem, it was not easy. How do you define progress? How is it different for different kinds of outputs in a graph? The questions were many.
I, however, did not have to go far to get answers. The Tez community actively came to a newbie’s rescue, finding answers and posing important questions. I started attending the bi-weekly Tez community sync up calls and asking existing contributors and committers for course correction. Suddenly the team was much bigger, the goals much more chiseled. This was new to anyone like me who came from the networking industry, where the most open part of the code are the RFCs and the implementation details are often hidden. These meetings served as a clean room for our coding ideas and experiments. Ideas were shared, to the extent of which data structure we should pick and what a future user of Tez would take from it. In between the usual status updates and extensive knowledge transfers were made.
Oath uses Apache Pig and Apache Hive extensively and most of the urgent requirements and requests came from Pig and Hive developers and users. Each issue led to a community JIRA and as we started running Tez at Oath scale, new feature ideas and bugs around performance and resource utilization materialized. Every year most of the Hadoop team at Oath travels to the Hadoop Summit where we meet our cohorts from the Apache community and we stand for hours discussing the state of the art and what is next for the project. One such discussion set the course for the next year and a half for me.
We needed an innovative way to shuffle data. Frameworks like MapReduce and Tez have a shuffle phase in their processing lifecycle wherein the data from upstream producers is made available to downstream consumers. Even though Apache Tez was designed with a feature set corresponding to optimization requirements in Pig and Hive, the Shuffle Handler Service was retrofitted from MapReduce at the time of the project’s inception. With several thousands of jobs on our clusters leveraging these features in Tez, the Shuffle Handler Service became a clear performance bottleneck. So as we stood talking about our experience with Tez with our friends from the community, we decided to implement a new Shuffle Handler for Tez. All the conversation points were tracked now through an umbrella JIRA TEZ-3334 and the to-do list was long. I picked a few JIRAs and as I started reading through I realized, this is all new code I get to contribute to and review. There might be a better way to put this, but to be honest it was just a lot of fun! All the whiteboards were full, the team took walks post lunch and discussed how to go about defining the API. Countless hours were spent debugging hangs while fetching data and looking at stack traces and Wireshark captures from our test runs. Six months in and we had the feature on our sandbox clusters. There were moments ranging from sheer frustration to absolute exhilaration with high fives as we continued to address review comments and fixing big and small issues with this evolving feature.
As much as owning your code is valued everywhere in the software community, I would never go on to say “I did this!” In fact, “we did!” It is this strong sense of shared ownership and fluid team structure that makes the open source experience at Apache truly rewarding. This is just one example. A lot of the work that was done in Tez was leveraged by the Hive and Pig community and cross Apache product community interaction made the work ever more interesting and challenging. Triaging and fixing issues with the Tez rollout led us to hit a 100% migration score last year and we also rolled the Tez Shuffle Handler Service out to our research clusters. As of last year we have run around 100 million Tez DAGs with a total of 50 billion tasks over almost 38,000 nodes.
In 2018 as I move on to explore Hadoop 3.0 as our future release, I hope that if someone outside the Apache community is reading this, it will inspire and intrigue them to contribute to a project of their choice. As an astronomy aficionado, going from a newbie Apache contributor to a newbie Apache committer was very much like looking through my telescope - it has endless possibilities and challenges you to be your best.
About the Author:
Kuhu Shukla is a software engineer at Oath and did her Masters in Computer Science at North Carolina State University. She works on the Big Data Platforms team on Apache Tez, YARN and HDFS with a lot of talented Apache PMCs and Committers in Champaign, Illinois. A recent Apache Tez Committer herself she continues to contribute to YARN and HDFS and spoke at the 2017 Dataworks Hadoop Summit on “Tez Shuffle Handler: Shuffling At Scale With Apache Hadoop”. Prior to that she worked on Juniper Networks’ router and switch configuration APIs. She likes to participate in open source conferences and women in tech events. In her spare time she loves singing Indian classical and jazz, laughing, whale watching, hiking and peering through her Dobsonian telescope.
When it comes to performance and reliability, there is perhaps no application where this matters more than with email. Today, we announced a new Yahoo Mail experience for desktop based on a completely rewritten tech stack that embodies these fundamental considerations and more.
We built the new Yahoo Mail experience using a best-in-class front-end tech stack with open source technologies including React, Redux, Node.js, react-intl (open-sourced by Yahoo), and others. A high-level architectural diagram of our stack is below.
New Yahoo Mail Tech Stack
In building our new tech stack, we made use of the most modern tools available in the industry to come up with the best experience for our users by optimizing the following fundamentals:
Performance
A key feature of the new Yahoo Mail architecture is blazing-fast initial loading (aka, launch).
We introduced new network routing which sends users to their nearest geo-located email servers (proximity-based routing). This has resulted in a significant reduction in time to first byte and should be immediately noticeable to our international users in particular.
We now do server-side rendering to allow our users to see their mail sooner. This change will be immediately noticeable to our low-bandwidth users. Our application is isomorphic, meaning that the same code runs on the server (using Node.js) and the client. Prior versions of Yahoo Mail had programming logic duplicated on the server and the client because we used PHP on the server and JavaScript on the client.
Usingefficient bundling strategies (JavaScript code is separated into application, vendor, and lazy loaded bundles) and pushing only the changed bundles during production pushes, we keep the cache hit ratio high. By using react-atomic-css, our homegrown solution for writing modular and scoped CSS in React, we get much better CSS reuse.
In prior versions of Yahoo Mail, the need to run various experiments in parallel resulted in additional branching and bloating of our JavaScript and CSS code. While rewriting all of our code, we solved this issue using Mendel, our homegrown solution for bucket testing isomorphic web apps, which we have open sourced.
Rather than using custom libraries, we use native HTML5 APIs and ES6 heavily and use PolyesterJS, our homegrown polyfill solution, to fill the gaps. These factors have further helped us to keep payload size minimal.
With all the above optimizations, we have been able to reduce our JavaScript and CSS footprint by approximately 50% compared to the previous desktop version of Yahoo Mail, helping us achieve a blazing-fast launch.
In addition to initial launch improvements, key features like search and message read (when a user opens an email to read it) have also benefited from the above optimizations and are considerably faster in the latest version of Yahoo Mail.
We also significantly reduced the memory consumed by Yahoo Mail on the browser. This is especially noticeable during a long running session.
Reliability
With this new version of Yahoo Mail, we have a 99.99% success rate on core flows: launch, message read, compose, search, and actions that affect messages. Accomplishing this over several billion user actions a day is a significant feat. Client-side errors (JavaScript exceptions) are reduced significantly when compared to prior Yahoo Mail versions.
Product agility and launch velocity
We focused on independently deployable components. As part of the re-architecture of Yahoo Mail, we invested in a robust continuous integration and delivery flow. Our new pipeline allows for daily (or more) pushes to all Mail users, and we push only the bundles that are modified, which keeps the cache hit ratio high.
Developer effectiveness and satisfaction
In developing our tech stack for the new Yahoo Mail experience, we heavily leveraged open source technologies, which allowed us to ensure a shorter learning curve for new engineers. We were able to implement a consistent and intuitive onboarding program for 30+ developers and are now using our program for all new hires. During the development process, we emphasise predictable flows and easy debugging.
Accessibility
The accessibility of this new version of Yahoo Mail is state of the art and delivers outstanding usability (efficiency) in addition to accessibility. It features six enhanced visual themes that can provide accommodation for people with low vision and has been optimized for use with Assistive Technology including alternate input devices, magnifiers, and popular screen readers such as NVDA and VoiceOver. These features have been rigorously evaluated and incorporate feedback from users with disabilities. It sets a new standard for the accessibility of web-based mail and is our most-accessible Mail experienceyet.
Open source
We have open sourced some key components of our new Mail stack, like Mendel, our solution for bucket testing isomorphic web applications. We invite the community to use and build upon our code. Going forward, we plan on also open sourcing additional components like react-atomic-css, our solution for writing modular and scoped CSS in React, and lazy-component, our solution for on-demand loading of resources.
Many of our company’s best technical minds came together to write a brand new tech stack and enable a delightful new Yahoo Mail experience for our users.
We encourage our users and engineering peers in the industry to test the limits of our application, and to provide feedback by clicking on the Give Feedback call out in the lower left corner of the new version of Yahoo Mail.
By Michael Natkovich, Akshai Sarma, Nathan Speidel, Marcus Svedman, and Cat Utah
Big Data is no longer just Apache server logs. Nowadays, the data may be user engagement data, performance metrics, IoT (Internet of Things) data, or something else completely atypical. Regardless of the size of the data, or the type of querying patterns on it (exploratory, ad-hoc, periodic, long-term, etc.), everyone wants queries to be as fast as possible and cheap to run in terms of resources. Data can be broadly split into two kinds: the streaming (generally real-time) kind or the batched-up-over-a-time-interval (e.g., hourly or daily) kind. The batch version is typically easier to query since it is stored somewhere like a data warehouse that has nice SQL-like interfaces or an easy to use UI provided by tools such as Tableau, Looker, or Superset. Running arbitrary queries on streaming data quicklyandcheaply though, is generally much harder… until now. Today, we are pleased to share our newly open sourced, forward-looking general purpose query engine, called Bullet, with the community on GitHub.
With Bullet, you can:
Powerful and nested filtering
Fetching raw data records
Aggregating data using Group Bys (Sum, Count, Average, etc.), Count Distincts, Top Ks
Getting distributions of fields like Percentiles or Frequency histograms
One of the key differences between how Bullet queries data and the standard querying paradigm is that Bullet does not store any data. In most other systems where you have a persistence layer (including in-memory storage), you are doing a look-back when you query the layer. Instead, Bullet operates on data flowing through the system after the query is started – it’s a look-forward system that doesn’t need persistence. On a real-time data stream, this means that Bullet is querying data after the query is submitted. This also means that Bullet does not query any data that has already passed through the stream. The fact that Bullet does not rely on a persistence layer is exactly what makes it extremely lightweight and cheap to run.
To see why this is better for the kinds of use cases Bullet is meant for – such as quickly looking at some metric, checking some assumption, iterating on a query, checking the status of something right now, etc. – consider the following: if you had a 1000 queries in a traditional query system that operated on the same data, these query systems would most likely scan the data 1000 times each. By the very virtue of it being forward looking, 1000 queries in Bullet scan the data only once because the arrival of the query determines and fixes the data that it will see. Essentially, the data is coming to the queries instead of the queries being farmed out to where the data is. When the conditions of the query are satisfied (usually a time window or a number of events), the query terminates and returns you the result.
A Brief Architecture Overview
High Level Bullet Architecture
The Bullet architecture is multi-tenant, can scale linearly for more queries and/or more data, and has been tested to handle 700+ simultaneous queries on a data stream that had up to 1.5 million records per second, or 5-6 GB/s. Bullet is currently implemented on top of Storm and can be extended to support other stream processing engines as well, like Spark Streaming or Flink. Bullet is pluggable, so you can plug in any source of data that can be read in Storm by implementing a simple data container interface to let Bullet work with it.
The UI, web service, and the backend layers constitute your standard three-tier architecture. The Bullet backend can be split into three main subsystems:
Request Processor – receives queries, adds metadata, and sends it to the rest of the system
Data Processor – reads data from an input stream, converts it to a unified data format, and matches it against queries
Combiner – combines results for different queries, performs final aggregations, and returns results
The web service can be deployed on any servlet container, like Jetty. The UI is a Node-based Ember application that runs in the client browser. Our full documentation contains all the details on exactly how we perform computationally-intractable queries like Count Distincts on fields with cardinality in the millions, etc. (DataSketches).
Usage at Yahoo
An instance of Bullet is currently running at Yahoo in production against a small subset of Yahoo’s user engagement data stream. This data is roughly 100,000 records per second and is about 130 MB/s compressed. Bullet queries this with about 100 CPU Virtual Cores and 120 GB of RAM. This fits on less than 2 of our (64 Virtual Cores, 256 GB RAM each) test Storm cluster machines.
One of the most popular use cases at Yahoo is to use Bullet to manually validate the instrumentation of an app or web application. Instrumentation produces user engagement data like clicks, views, swipes, etc. Since this data powers everything we do from analytics to personalization to targeting, it is absolutely critical that the data is correct. The usage pattern is generally to:
Submit a Bullet query to obtain data associated with your mobile device or browser (filter on a cookie value or mobile device ID)
Open and use the application to generate the data while the Bullet query is running
Go back to Bullet and inspect the data
In addition, Bullet is also used programmatically in continuous delivery pipelines for functional testing instrumentation on product releases. Product usage is simulated, then data is generated and validated in seconds using Bullet. Bullet is orders of magnitude faster to use for this kind of validation and for general data exploration use cases, as opposed to waiting for the data to be available in Hive or other systems. The Bullet UI supports pivot tables and a multitude of charting options that may speed up analysis further compared to other querying options.
We also use Bullet to do a bunch of other interesting things, including instances where we dynamically compute cardinalities (using a Count Distinct Bullet query) of fields as a check to protect systems that can’t support extremely high cardinalities for fields like Druid.
What you do with Bullet is entirely determined by the data you put it on. If you put it on data that is essentially some set of performance metrics (data center statistics for example), you could be running a lot of queries that find the 95th and 99th percentile of a metric. If you put it on user engagement data, you could be validating instrumentation and mostly looking at raw data.
We hope you will find Bullet interesting and tell us how you use it. If you find something you want to change, improve, or fix, your contributions and ideas are always welcome! You can contact us here.
Today, we are pleased to offer Daytona, an open-source framework for automated performance testing and analysis, to the community. Daytona is an application-agnostic framework to conduct integrated performance testing and analysis with repeatable test execution, standardized reporting, and built-in profiling support.
Daytona gives you the capability to build a customized test harness in a single, unified framework to test and analyze the performance of any application. You’ll get easy repeatability, consistent reporting, and the ability to capture trends. Daytona’s UI accepts a performance testing script that can run on a command line. This includes websites, databases, networks, or any workload you need to test and tune for performance. You can submit tests to the scheduler queue from the Daytona UI or from your CI/CD tool. You can deploy Daytona as a hosted service in your on-prem environment or on the public cloud of your choice. In fact, you can even host test harnesses for multiple applications with a single centralized service so that developers, architects, and systems engineers from different parts of your organization can work together on a unified view and manage your performance analysis on a continuous basis.
Daytona’s differentiation lies in its ability to aggregate and present essential aspects of application, system, and hardware performance metrics with a simple and unified user interface. This helps you maintain your focus on performance analysis without changing context across various sources and formats of data. The overall goal of performance analysis is to find ways of maximizing application throughput with minimum hardware resource and the best user experience. Metrics and insights from Daytona help achieve this objective.
Prior to Daytona, we created multiple, heterogenous performance tools to meet the specific needs of various applications. This meant that we often stored test results inconsistently, making it harder to analyze performance in a comprehensive manner. We had a difficult time sharing results and analyzing differences in test runs in a standard manner, which could lead to confusion.
With Daytona, we are now able to integrate all our load testing tools under a single framework and aggregate test results in one common central repository. We are gaining insight into the performance characteristics of many of our applications on a continuous basis. These insights help us optimize our applications which results in better utilization of our hardware resources and helps improve user experience by reducing the latency to serve end-user requests. Ultimately, Daytona helps us reduce capital expenditure on our large-scale infrastructure and makes our applications more robust under load. Sharing performance results in a common format encourages the use of common optimization techniques that we can leverage across many different applications.
Daytona was built knowing that we would want to publish it as open source and share the technology with the community for validation and improvement of the framework. We hope the community can help extend its use cases and make it suitable for an even broader set of applications and workloads.
Architecture
Daytona is comprised of a centralized scheduler, a distributed set of agents running on SUTs (systems under test), a MySQL database to store all metadata for tests, and a PHP-based UI. A test harness can be customized by answering a simple set of questions about the application/workload. A test can be submitted to Daytona’s queue through the UI or through a CLI (Command Line Interface) from the CI/CD system. The scheduler process polls the database for a test to be run and sends all the actions associated with the execution of the test to the agent running on a SUT. An agent process executes the test, collects application and system performance metrics, and sends the metrics back as a package to the scheduler. The scheduler saves the test metadata in the database and test results in the local file system. Tests from multiple harnesses proceed concurrently.
Architecture and Life Cycle Of A Test
Looking Forward
Our goal is to integrate Daytona with popular open source CI/CD tools and we welcome contributions from the community to make that happen. It is available under Apache License Version 2.0. To evaluate Daytona, we provide simple instructions to deploy it on your in-house bare metal, VM, or public cloud infrastructure. We also provide instructions so you can quickly have a test and development environment up and running on your laptop with Docker. Please join us on the path of making application performance analysis an enjoyable and insightful experience. Visit the Daytona Yahoo repo to get started!
Terrapattern is an open-source AI project to find patterns in satelite imagery. Use it for example to find colorful containerterminal like I did or boats, solarpanels, or baseball stadiums.
Making a progressive web app with webpack just got a little bit easier
Today we are releasing webpack-web-app-manifest-plugin, which generates an app manifest that shows up in your assets manifest.
I heard you like manifests
Turns out, there are a lot of web things called “manifests”. When talking about web app manifests and assets manifests, sometimes it’s hard to keep track. Buckle up, because we made a webpack plugin that deals with both of these types of manifests.
Web app manifests are JSON files that allow your application to specify the way it should be treated when installed as an application on a mobile device. You may want to specify what the application name and icon should be. Maybe you want to tell the browser to tint some of its UI elements to match the color scheme of your page, or even hide the browser chrome entirely. You can do all of that with a web app manifest.
Assets manifests are JSON files that contain paths to assets that are generated by webpack. They’re generated by plugins such as assets-webpack-plugin. If you add hashes to the end of your filenames to allow cache busting, assets manifests can be very useful. For example, we use our assets manifest to add JavaScript and CSS files to our <script> and <link> tags.
So I put a manifest in your manifest
While we were building our web app manifest, we wanted to be able to add a hash to the file path and <link> to it. So we needed to add it to our assets manifest. Unfortunately, we were unable to find any existing open-source plugins that output the file in the correct way to add it to the app manifest. So, we built webpack-web-app-manifest-plugin.
By default, webpack-web-app-manifest-plugin assumes that you will name your icon files in the format manifest/icon_[square dimension].(png|jpeg|jpg). If you name them using that scheme, you can use this plugin just like this:
// in your webpack config importAppManifestPluginfrom‘webpack-web-app-manifest-plugin’;
// in your page template constmanifest= // however you usually access your asset manifest in code constappManifestPath=manifest['app-manifest’].json;
<linkrel=“manifest”href={appManifestPath} />
If you named your icons with some other naming scheme, you can still add them to the web app manifest, it’s just a little more work. That process is detailed in the README.
Please use it
We’re really proud of the work we’ve done to make web app manifests compatible with asset manifests, which is why we’ve decided to open source it and publish it on npm. Please use it.
If this plugin doesn’t meet your needs, we welcome pull requests. And if you have a passion for progressive web applications, webpack, and open source, join our team!
The project is licensed under the Mozilla Public License v2. Check out the Projects tab on GitHub for an idea of what we’re working on, and how you can contribute. The README is a good place to see Kanvas in action and add it to your own app. And if you’re interested, follow the project, as we’ll be posting more documentation about how Kanvas work and the history of the project.
Thanks to everyone who’s contributed to Kanvas over the years, and we’re excited to see what this new open-source & WordPress chapter brings.
I know I’ve been MIA for a very long time- and I apologize for that- but now is a good time to revive this account and put it to good use!!! if anyone would like to use this platform to speak about the black lives matter movement or racial injustice in general, don’t hesitate to ask!!
you can do your part in your community by signing petitions, donating, protesting, or simply educating yourself!
there is a time and place for everything- and the time for change is right now.
Creating an open source software is an ongoing and exciting process. Recently, Oak open-source library delivered a new release: Oak0.2, which summarizes a year of collaboration. Oak0.2 makes significant improvements in throughput, memory utilization, and user interface.
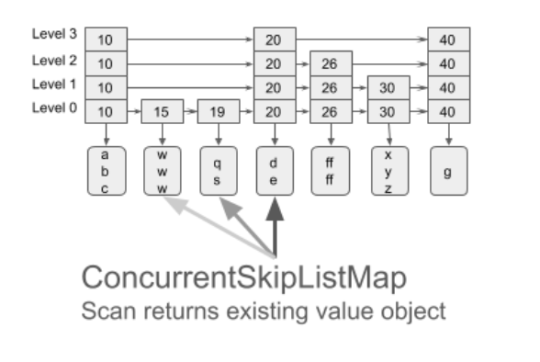
OakMap is a highly scalable Key-Value Map that keeps all keys and values off-heap. The Oak project is designed for Big Data real-time analytics. Moving data off-heap, enables working with huge memory sizes (above 100GB) while JVM is struggling to manage such heap sizes. OakMap implements the industry-standard Java8 ConcurrentNavigableMap API and more. It provides strong (atomic) semantics for read, write, and read-modify-write, as well as (non-atomic) range query (scan) operations, both forward and backward. OakMap is optimized for big keys and values, in particular, for incremental maintenance of objects (update in-place). It is faster and scales better with additional CPU cores than the popular Java’s ConcurrentNavigableMap implementationConcurrentSkipListMap.
Oak data is written to the off-heap buffers, thus needs to be serialized (converting an object in memory into a stream of bytes). For retrieval, data might be deserialized (object created from the stream of bytes). In addition, to save the cycles spent on deserialization, we allow reading/updating the data directly via OakBuffers. Oak provides this functionality under the ZeroCopy API.
If you aren’t already familiar with Oak, this is an excellent starting point to use it! Check it out and let us know if you have any questions.
Oak keeps getting better: Introducing Oak0.2
We have made a ton of great improvements to Oak0.2, adding a new stream scanning for improved performance, releasing a ground-up rewrite of our Zero Copy API’s buffers to increase safety and performance, and decreasing the on-heap memory requirement to be less than 3% of the raw data! As an exciting bonus, this release also includes a new version of our off-heap memory management, eliminating memory fragmentation.
Below we dive deeper into sub-projects being part of the release.
Stream Data Faster
When scanned data is held by any on-heap data structures, each next-step is very easy: get to the next object and return it. To retrieve the data held off-heap, even when using Zero-Copy API, it is required to create a new OakBuffer object to be returned upon each next step. Scanning Big Data that way will create millions of ephemeral objects, possibly unnecessarily, since the application only accesses this object in a short and scoped time in the execution.
To avoid this issue, the user can use our new Stream Scan API, where the same OakBuffer object is reused to be redirected to different keys or values. This way only one element can be observed at a time. Stream view of the data is frequently used for flushing in-memory data to disk, copying, analytics search, etc.
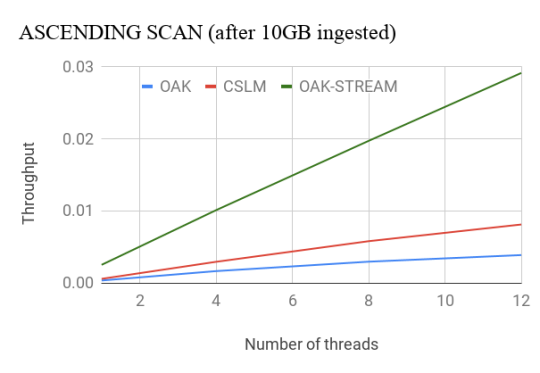
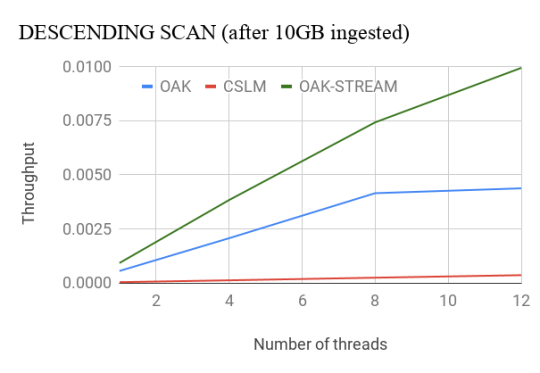
Oak’s Stream Scan API outperforms CSLM by nearly 4x for the ascending case. For the descending case, Oak outperforms CSLM by more than 8x even with less optimized non-stream API. With the Stream API, Oak’s throughput doubles. More details about the performance evaluation can be found here.
Safety or Performance? Both!
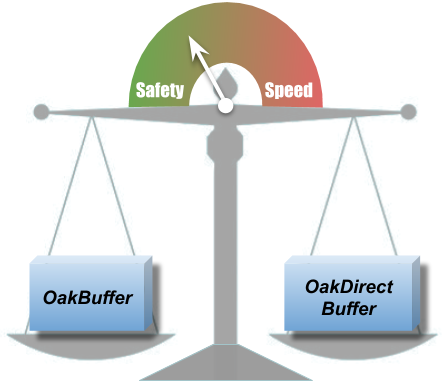
OakBuffers are core ZeroCopy API primitives. Previously, alongside with OakBuffers, OakMap exposed the underlying ByteBuffers directly to the user, for the performance. This could cause some data safety issues such as an erroneous reading of the wrong data, unintentional corrupting of the data, etc. We couldn’t choose between safety and performance, so strived to have both!
With Oak0.2, ByteBuffer is never exposed to the user. Users can choose to work either with OakBuffer which is safe or with OakUnsafeDirectBuffer which gives you faster access, but use it carefully. With OakUnsafeDirectBuffer, it is the user’s responsibility to synchronize and not to access deleted data, if the user is aware of those issues, OakUnsafeDirectBuffer is safe as well.
Our safe OakBuffer works with the same, great and known, OakMap performance, which wasn’t easy to achieve. However, if the user is interested in even superior speed of operations, any OakBuffer can be cast to OakUnsafeDirectBuffer.
Less (metadata) is more (data)
In the initial version of OakMap we had an object named handler that was a gateway to access any value. Handler was used for synchronization and memory management. Handler took about 256 bytes per each value and imposed dereferencing on each value access.
Handler is now replaced with an 8-bytes header located in the off-heap, next to the value. No dereferencing is needed. All information needed for synchronization and memory manager is kept there. In addition, to keep metadata even smaller, we eliminated the majority of the ephemeral object allocations that were used for internal calculations.
This means less memory is used for metadata and what was saved goes directly to keep more user data in the same memory budget. More than that, JVM GC has much less reasons to steal memory and CPU cycles, even when working with hundreds of GBs.
Fully Reusable Memory for Values
As explained above, 8-byte off-heap headers were introduced ahead of each value. The headers are used for memory reclamation and synchronization, and to hold lock data. As thread may hold the lock after a value is deleted, the header’s memory couldn’t be reused. Initially the header’s memory was abandoned, causing a memory leak.
The space allocated for value is exactly the value size, plus header size. Leaving the header not reclaimed, creates a memory “hole” where a new value of the same size can not fit in. As the values are usually of the same size, this was causing fragmentation. More memory was consumed leaving unused spaces behind.
We added a possibility to reuse the deleted headers for new values, by introducing a sophisticated memory management and locking mechanism. Therefore the new values can use the place of the old deleted value. With Oak0.2, the scenario of 50% puts and 50% deletes is running with a stable amount of memory and performs twice better than CSLM.
We look forward to growing the Oak community! We invite you to explore the project, use OakMap in your applications, raise issues, suggest improvements, and contribute code. If you have any questions, please feel free to send us a note. It would be great to hear from you!
Kishor Patil, PMC Chair Apache Storm & Sr. Principal Software Systems Engineer, Verizon Media
Last year, we shared with you many of the Apache Storm 2.0 improvements contributed by Verizon Media. At Yahoo/Verizon Media, we’ve been committing to Storm for many years. Today, we’re excited to explore a few of the new features, improvements, and bug fixes we’ve contributed to Storm 2.2.0.
NUMA Support
The server hardware is getting beefier and requires worker JVMs to be NUMA (Non-uniform memory access) aware. Without constraining JVMs to NUMA zones, we noticed dramatic degradation in the JVM performance; specifically for Storm where most of the JVM objects are short-lived and continuous GC cycles perform complete heap scan. This feature enables maximizing hardware utilization and consistent performance on asymmetric clusters. For more information please refer to [STORM-3259].
Auto Refreshing SSL Certificates for All Daemons
At Verizon Media, as part of maintaining thousands of Storm nodes, refreshing SSL/TLS certificates without any downtime is a priority. So we implemented auto refreshing SSL certificates for all daemons without outages. This becomes a very useful feature for operation teams to monitor and update certificates as part of hassle free continuous monitoring and maintenance. Included in the security related critical bug fixes the Verizon Media team noticed and fixed are:
Kerberos connectivity from worker to Nimbus/Supervisor for RPC heartbeats [STORM-3579]
This allows for deprecated metrics at worker level to utilize messaging and capture V1 metrics. This is a stop-gap giving topology developers sufficient time to switch from V1 metrics to V2 metrics API. The Verizon Media Storm team also provided shortening metrics names to allow for metrics names that conform to more aggregation strategies by dimension [STORM-3627]. We’ve also started removing deprecated metrics API usage within storm-core and storm-client modules and adding new metrics at nimbus/supervisor daemon level to monitor activity.
Scheduler Improvements
ConstraintSolverStrategy allows for max co-location count at the Component Level. This allows for better spread - [STORM-3585]. Both ResourceAwareScheduler and ConstraintSolverStrategy are refactored for faster performance. Now a large topology of 2500 component topology requesting complex constraints or resources can be scheduled in less than 30 seconds. This improvement helps lower downtime during topology relaunch - [STORM-3600]. Also, the blacklisting feature to detect supervisor daemon unavailability by nimbus is useful for failure detection in this release [STORM-3596].
OutputCollector Thread Safety
For messaging infrastructure, data corruption can happen when components are multi-threaded because of non thread-safe serializers. The patch [STORM-3620] allows for Bolt implementations that use OutputCollector in other threads than executor to emit tuples. The limitation is batch size 1. This important implementation change allows for avoiding data corruption without any performance overhead.
Noteworthy Bug Fixes
For LoadAwareShuffle Grouping, we were seeing a worker overloaded and tuples timing out with load aware shuffle enabled. The patch checks for low watermark limits before switching from Host local to Worker local - [STORM-3602].
For Storm UI, the topology visualization related bugs are fixed so topology DAG can be viewed more easily.
The bug fix to allow the administrator access to topology logs from UI and logviewer.
storm cli bug fixes to accurately process command line options.
What’s Next
In the next release, Verizon Media plans to contribute container support with Docker and RunC container managers. This should be a major boost with three important benefits - customization of system level dependencies for each topology with container images, better isolation of resources from other processes running on the bare metal, and allowing each topology to choose their worker OS and java version across the cluster.
Jeff Atkinson, Principal Security Engineer, Verizon Media
We are pleased to announce RDFP for Zeek. This project is based off of 0x4D31’s work, the FATT Remote Desktop Client fingerprinting. This technique analyzes client payloads during the RDP negotiation to build a profile of client software. RDFP extends RDP protocol parsing and provides security analysts a method of profiling software used on the network. BlueKeep identified some gaps in visibility spurring us to contribute to Zeek’s RDP protocol analyzer to extract additional details. Please share your questions and suggestions by filing an issue on Github.
Technical Details
RDFP extracts the following key elements and then generates an MD5 hash.
The first data block handled is Client Core Data. The client major and minor versions are extracted. Other information can be found in this datagram but is more specific to the client configuration and not specific to the client software.
Client Cluster Data
The Client Cluster Data datagram contains the Cluster Flags. These are added in the order they are seen and will provide information about session redirection and other items - ex: if a smart card was used.
Client Security Data
The Client Security Data datagram provides the encryptionMethods and extEncryptionMethods. The encryptionMethods details the key that is used and message authentication code. The extEncryptionMethods is a specific flag designated for French locale.
Client Network Data
The Client Network Data datagram contains the Channel Definition Structure, (Channel_Def). Channel_Def provides configuration information about how the virtual channel with the server should be set up. This datagram provides details on compression, MCS priority, and channel persistence across transactions.
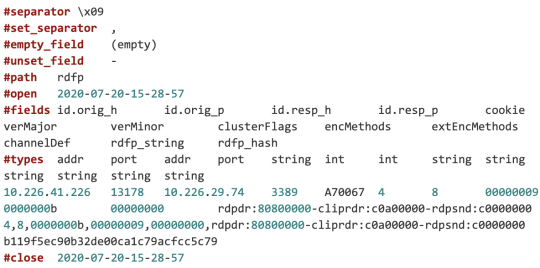
Here is the example rdfp.log generated by the rdfp.zeek script. The log provides all of the details along with the client rdfp_hash.
This technique works well, but notice that RDP clients can require TLS encryption. Reference the JA3 fingerprinting technique for TLS traffic analysis. Please refer to Adel’s blog post for additional details and examples about ways to leverage the RDP fingerprinting on the network.
Conclusion
Zeek RDFP extends network visibility into client software configurations. Analysts apply logic and detection techniques to these extended fields. Analysts and Engineers can also apply anomaly detection and additional algorithms to profile and alert suspicious network patterns.
In the previous update, we mentioned Improved Slow Node Tolerance, Multi-Threaded Rank Profile Compilation, Reduced Peak Memory at Startup, Feed Performance Improvements, and Increased Tensor Performance. This month, we’re excited to share the following updates:
Support for Approximate Nearest Neighbor Vector Search
Vespa now supports approximate nearest neighbor search which can be combined with filters and text search. By using a native implementation of the HNSW algorithm, Vespa provides state of the art performance on vector search: Typical single digit millisecond response time, searching hundreds of millions of documents per node, but also uniquely allows vector query operators to be combined efficiently with filters and text search - which is usually a requirement for real-world applications such as text search and recommendation. Vectors can be updated in real-time with a sustained write rate of a few thousand vectors per node per second. Read more in the documentation on nearest neighbor search.
Streaming Search Speedup
Streaming Search is a feature unique to Vespa. It is optimized for use cases like personal search and e-mail search - but is also useful in high-write applications querying a fraction of the total data set. With #13508, read throughput from storage increased up to 5x due to better parallelism.
Rank Features
The (Native)fieldMatch rank features are optimized to use less CPU query time, improving query latency for Text Matching and Ranking.
The new globalSequence rank feature is an inexpensive global ordering of documents in a system with stable system state. For a system where node indexes change, this is inaccurate. See globalSequence documentation for alternatives.
About Vespa: Largely developed by Yahoo engineers, Vespa is an open source big data processing and serving engine. It’s in use by many products, such as Yahoo News, Yahoo Sports, Yahoo Finance, and the Verizon Media Ad Platform. Thanks to feedback and contributions from the community, Vespa continues to grow.
We welcome your contributions and feedback (tweetoremail) about any of these new features or future improvements you’d like to request.
Jeff Atkinson, Principal Security Engineer, Verizon Media
Today we are excited to announce the release of Spicy Noise. This open source project was developed to address the need to identify and monitor WireGuard traffic at line speed with Zeek. The Spicy framework was chosen to build the protocol parser needed for this project. Please share your questions and suggestions by filing an issue on Github.
WireGuard was implemented on the Noise Protocol Framework to provide simple, fast, and secure cryptographic communication. Its popularity started within the Linux community due to its ability to run on Raspberry Pi and high end servers. The protocol has now been adopted and is being used cross platform. To explain how Spicy Noise works, let’s look at how Zeek and Spicy help monitor traffic.
Zeek is a network monitoring project that is robust and highly scalable. It supports multiple protocol analyzers on a standard install and provides invaluable telemetry for threat hunting and investigations. Zeek has been deployed on 100 gigabit networks.
Spicy is a framework provided by the Zeek community to build new protocol analyzers. It is replacing Binpac as a much simpler method to build protocol parsers. The framework has built-in integration with Zeek to enable analysis at line speed.
How it works
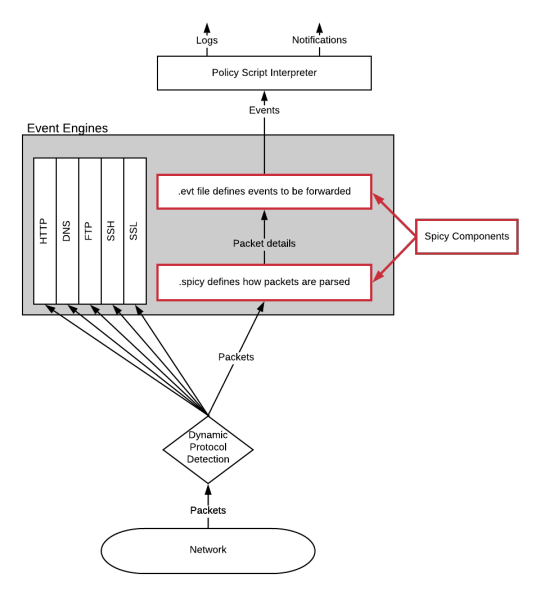
Zeek’s Architecture begins by reading packets from the network. The packets are then routed to “Event Engines” which parse the packets and forward events containing details of the packet. These events are presented to the “Policy Script Interpreter” where the details from the event can be acted upon by Zeek scripts. There are many scripts which ship with Zeek to generate logs and raise notifications. Many of these logs and notifications are forwarded to the SIEM of a SOC for analysis.
To build the capability to parse WireGuard traffic a new “Event Engine” has been created. This is done with Spicy by defining how a packet is parsed and how events are created. Packet parsing is defined in a .spicy file. Events are defined in a .evt file which will forward the details extracted by the .spicy parser for the “Policy Script Interpreter”. A dynamic protocol detection signature has to be defined so Zeek knows how to route packets to the new Event Engine. Refer to the diagram below to understand the role of the .spicy and .evt files of the new WireGuard parser or “Event Engine”.
Technical Implementation
The first step to building a new “Event Engine” is to define how the packet is to be parsed. Referring to the WireGuard protocol specification, there are four main UDP datagram structures. The four datagram structures defined are the Handshake Initiation, Handshake Response, Cookie Reply, and Transport Data. The diagram below depicts how the client and server communicate.
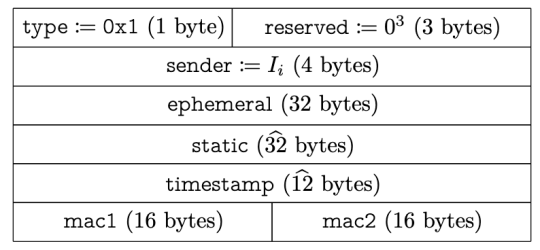
We will focus on the first, Handshake Response, but the same method is used to apply to the other three packet structures. The following diagram from the WireGuard whitepaper illustrates the structure of the Handshake Initiation packet.
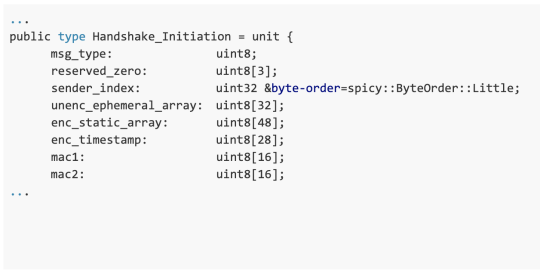
The sections of the packet are defined with their respective sizes. These details are used in the .spicy file to define how Spicy will handle the packet. Note that the first field is the packet type and a value of 1 defines it as a Handshake Initiation structured packet. Below is a code snippet of wg-1.spicy from the repository. A type is created to define the fields and their size or delimiters.
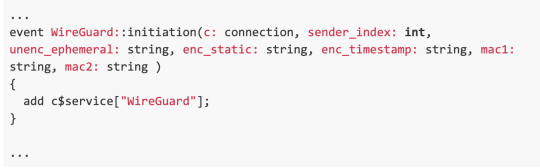
Spicy uses wg-1.spicy as the first part of the “Event Engine” to parse packets. The next part needed is to define events in the .evt file. An event is created for each packet type to pass values from the “Event Engine” to the “Policy Script Interpreter”.
The .evt file also includes an “Analyzer Setup” which defines the Analyzer_Name, Transport_Portocol and additional details if needed.
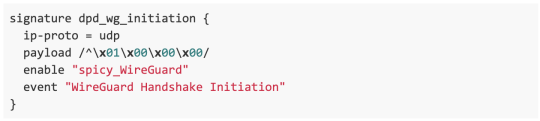
The Analyzer_Name is used by dynamic protocol detection (DPD). Zeek reads packets and compares them against DPD signatures to identify which Analyzer or “Event Engine” to use. The Wireguard DPD signature looks for the first byte of a UDP datagram to be 1 followed by the reserved zeros as defined in the protocol specification. Below is the DPD signature created for matching on the WireGuard Handshake_Initiation packet which is the first in the session.
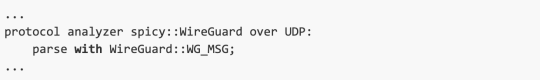
Now as Spicy or Zeek parse packets, anytime a packet is parsed by the Handshake_Initiation type it will generate an event. The event will include connection details stored in the $conn variable which is passed from the stream processor portion of the “Event Engine.” The additional fields are extracted from the packet as defined in the corresponding .spicy file type. These events are received by the “Policy Script Interpreter” and can be acted upon to create logs or raise notifications. Zeek scripts define which events to receive and what action is to be taken. The example below shows how the WireGuard::Initiation event can be used to set the service field in Zeek’s conn.log.
The conn.log file will now have events with a service of WireGuard.
Conclusion
Wireguard provides an encrypted tunnel which can be used to circumvent security controls. Zeek and Spicy provide a solution to enhance network telemetry allowing better understanding of the traffic. Standard network analysis can be applied with an understanding that WireGuard is in use and encrypting the traffic.
Luke Larsen, Sr Software Dev Engineer, Verizon Media
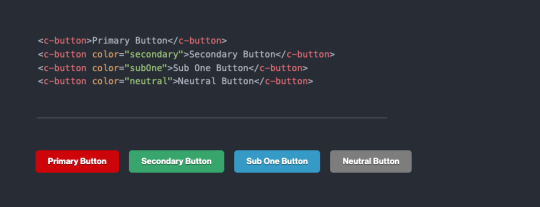
As part of the Media Platform Video Team we build and maintain a set of web applications that allow customers to manage their video content. We needed a way to be consistent with how we build these applications. Creating consistent layouts and interfaces can be a challenge. There are many areas that can cause bloat or duplication of code. Some examples of this are, coding multiple ways to build the same layout in the app, slight variations of the same red color scattered all over, multiple functions being used to capitalize data returned from the database. To avoid cases like this we built Bindable. Bindable is an open source design system that makes it possible to achieve consistency in colors, fonts, spacing, sizing, user actions, user permissions, and content conversion. We’ve found it helps us be consistent in how we build layouts, components, and share code across applications. By making Bindable open source we hope it will do the same for others.
Theming
One problem with using a design system or library is that you are often forced to use the visual style that comes with it. With Bindable you can customize how it looks to fit your visual style. This is accomplished through CSS custom properties. You can create your own custom theme by setting these variables and you will end up with your own visual style.
Modular Scale
Harmony in an application can be achieved by setting all the sizing and spacing to a value on a scale. Bindable has a modular scale built in. You can set the scale to whatever you wish and it will adjust. This means your application will have visual harmony. When you need, you can break out of the modular scale for custom sizing and spacing.
Aurelia
Aurelia is a simple, powerful, and unobtrusive javascript framework. Using Aurelia allows us to take advantage of its high performance and extensibility when creating components. Many parts of Bindable have added features thanks to Aurelia.
Tokens
Tokens are small building blocks that all other parts of Bindable use. They are CSS custom properties and set things like colors, fonts, and transitions.
Layouts
The issue of creating the same layout using multiple methods is solved by Layouts in Bindable. Some of the Layouts in Bindable make it easy to set a grid, sidebar, or cluster of items in a row. Layouts also handle all the spacing between components. This keeps all your spacing orderly and consistent.
Components
Sharing these components was one of the principal reasons the library exists. There are over 40 components available, and they are highly customizable depending on your needs.
Access Modifiers
Bindable allows developers to easily change the state of a component on a variety of conditions. Components can be hidden or disabled if a user lacks permission for a particular section of a page. Or maybe you just need to add a loading indicator to a button. These attributes make it easy to do either (or both!).
Value Converters
We’ve included a set of value converters that will take care of some of the most basic conversions for you. Things like sanitizing HTML, converting CSV data into an array, escaping a regex string, and even more simple things like capitalizing a string or formatting an ISO Date string.
Use, Contribute, & Reach Out
Explore the Bindable website for helpful details about getting started and to see detailed info about a given component. We are excited to share Bindable with the open source community. We look forward to seeing what others build with Bindable, especially Aurelia developers. We welcome pull requestsandfeedback! Watch the project on GitHub for updates. Thanks!
vSSH is a high performance Go library designed to execute shell commands remotely on tens of thousands of network devices or servers over SSH protocol. The vSSH high-level API provides additional functionality for developing network or server automation. It supports persistent SSH connection to execute shell commands with a warm connection and returns data back quickly.
If you manage multiple Linux machines or devices you know how difficult it is to run commands on multiple machines every day, and appreciate the significant value of automation. There are other open source SSH libraries available in a variety of languages but vSSH has great features like persistent SSH connection, the ability to limit sessions, to limit the amount of data transferred, and it handles many SSH connections concurrently while using resources efficiently. Go developers can quickly create the network device, server automation, or tools, by using this library and focusing on the business logic instead of handling SSH connections.
vSSH can run on your application asynchronous and then you can call the APIs/methods through your application (safe concurrency). To start, load your clients information and add them to vSSH using a simple method. You can add labels and other optional attributes to each client. By calling the run method, vSSH sends the given command to all available clients or based on your query, it runs the command on the specific clients and the results of the command can be received in streaming (real-time) or the final result.
One of the main features of vSSH is a persistent connection to all devices and the ability to manage them. It can connect to all the configured devices/servers, all the time. The connections are simple authenticated connections without session at the first stage. When vSSH needs to run a command, it tries to create a session and it closes the session when it’s completed. If you don’t need the persistence feature then you can disable it, which results in the connection closing at the end. The main advantage of persistence is that it works as a warm connection and once the run command is requested, it just needs to create a session. The main use case is when you need to run commands on the clients continuously or the response time is important. In both cases, vSSH multiplexes sessions at one connection.
vSSH provides a DSL query feature based on the provided labels that you can use to select / filter clients. It supports operators like == != or you can also create your own logic. I wrote this feature with the Go abstract syntax tree (AST). This feature is very useful as you can add many clients to the library at the same time and run different commands based on the labels.
Here are three features that you can use to control the load on the client and force to terminate the running command:
By limiting the returned data which comes from stdout or stderr in bytes
BySam Groth, Senior Software Engineer, Verizon Media
Do you have data in Apache Hadoop using Apache HDFS that is made available with Apache Hive? Do you spend too much time manually cleaning old data or maintaining multiple scripts? In this post, we will share why we created and open sourced the Data Disposal tool, as well as, how you can use it.
Data retention is the process of keeping useful data and deleting data that may no longer be proper to store. Why delete data? It could be too old, consume too much space, or be subject to legal retention requirements to purge data within a certain time period of acquisition.
Retention tools generally handle deleting data entities (such as files, partitions, etc.) based on: duration, granularity, or date format.
Duration: The length of time before the current date. For example, 1 week, 1 month, etc.
Granularity: The frequency that the entity is generated. Some entities like a dataset may generate new content every hour and store this in a directory partitioned by date.
Date Format: Data is generally partitioned by a date so the format of the date needs to be used in order to find all relevant entities.
Introducing Data Disposal
We found many of the existing tools we looked at lacked critical features we needed, such as configurable date format for parsing from the directory path or partition of the data and extensible code base for meeting the current, as well as, future requirements. Each tool was also built for retention with a specific system like Apache Hive or Apache HDFS instead of providing a generic tool. This inspired us to create Data Disposal.
The Data Disposal tool currently supports the two main use cases discussed below but the interface is extensible to any other data stores in your use case.
File retention on the Apache HDFS.
Partition retention on Apache Hive tables.
Disposal Process
The basic process for disposal is 3 steps:
Read the provided yaml config files.
Run Apache Hive Disposal for all Hive config entries.
Run Apache HDFS Disposal for all HDFS config entries.
The order of the disposals is significant in that if Apache HDFS disposal ran first, it would be possible for queries to Apache Hive to have missing data partitions.
Key Features
The interface and functionality is coded in Java using Apache HDFS Java API and Apache Hive HCatClient API.
Yaml config provides a clean interface to create and maintain your retention process.
Flexible date formatting using Java’s SimpleDateFormat when the date is stored in an Apache HDFS file path or in an Apache Hive partition key.
Flexible granularity using Java’s ChronoUnit.
Ability to schedule with your preferred scheduler.
The current use cases all use Screwdriver, which is an open source build platform designed for continuous delivery, but using other schedulers like cron, Apache Oozie, Apache Airflow, or a different scheduler would be fine.
Future Enhancements
We look forward to making the following enhancements:
Retention for other data stores based on your requirements.
Support for file retention when configuring Apache Hive retention on external tables.
Any other requirements you may have.
Contributions are welcome! The Data team located in Champaign, Illinois, is always excited to accept external contributions. Please file an issue to discuss your requirements.
In the April updates, we mentioned Improved Performance for Large Fan-out Applications, Improved Node Auto-fail Handling, CloudWatch Metric Import and CentOS 7 Dev Environment. This month, we’re excited to share the following updates:
Improved Slow Node Tolerance
To improve query scaling, applications can group content nodes to balance static and dynamic query cost. The largest Vespa applications use a few hundred nodes. This is a great feature to optimize cost vs performance in high-query applications. Since Vespa-7.225.71, the adaptive dispatch policy is made default. This balances load to the node groups based on latency rather than just round robin - a slower node will get less load and overall latency is lower.
Multi-Threaded Rank Profile Compilation
Queries are using a rank profile to score documents. Rank profiles can be huge, like machine learned models. The models are compiled and validated when deployed to Vespa. Since Vespa-7.225.71, the compilation is multi-threaded, cutting compile time to 10% for large models. This makes content node startup quicker, which is important for rolling upgrades.
Reduced Peak Memory at Startup
Attributes is a unique Vespa feature used for high feed performance for low-latency applications. It enables writing directly to memory for immediate serving. At restart, these structures are reloaded. Since Vespa-7.225.71, the largest attribute is loaded first, to minimize temporary memory usage. As memory is sized for peak usage, this cuts content node size requirements for applications with large variations in attribute size. Applications should keep memory at less than 80% of AWS EC2 instance size.
Feed Performance Improvements
At times, batches of documents are deleted. This subsequently triggers compaction. Since Vespa-7.227.2, compaction is blocked at high removal rates, reducing overall load. Compaction resumes once the remove rate is low again.
Increased Tensor Performance
Tensor is a field type used in advanced ranking expressions, with heavy CPU usage. Simple tensor joins are now optimized and more optimizations will follow in June.
…
About Vespa: Largely developed by Yahoo engineers, Vespa is an open source big data processing and serving engine. It’s in use by many products, such as Yahoo News, Yahoo Sports, Yahoo Finance, and the Verizon Media Ad Platform. Thanks to feedback and contributions from the community, Vespa continues to grow.
We welcome your contributions and feedback (tweetoremail) about any of these new features or future improvements you’d like to request.
In the previous update, we mentioned Ranking with LightGBM Models, Matrix Multiplication Performance, Benchmarking Guide, Query Builder and Hadoop Integration. This month, we’re excited to share the following updates:
Improved Performance for Large Fan-out Applications
Vespa container nodes execute queries by fanning out to a set of content nodes evaluating parts of the data in parallel. When fan-out or partial results from each node is large, this can cause bandwidth to run out. Vespa now provides an optimization which lets you control the tradeoff between the size of the partial results vs. the probability of getting a 100% global result. As this works out, tolerating a small probability of less than 100% correctness gives a large reduction in network usage. Read more.
Improved Node Auto-fail Handling
Whenever content nodes fail, data is auto-migrated to other nodes. This consumes resources on both sender and receiver nodes, competing with resources used for processing client operations. Starting with Vespa-7.197, we have improved operation and thread scheduling, which reduces the impact on client document API operation latencies when a node is under heavy migration load.
Adevelopment environment for Vespa on CentOS 7 is now available. This ensures that the turnaround time between code changes and running unit tests and system tests is short, and makes it easier to contribute to Vespa.
About Vespa: Largely developed by Yahoo engineers, Vespa is an open source big data processing and serving engine. It’s in use by many products, such as Yahoo News, Yahoo Sports, Yahoo Finance, and the Verizon Media Ad Platform. Thanks to feedback and contributions from the community, Vespa continues to grow.
We welcome your contributions and feedback (tweetoremail) about any of these new features or future improvements you’d like to request.
Amit Nagpal, Sr. Director, Software Development Engineering, Verizon Media
Among many interesting teams at Verizon Media is the Yahoo Knowledge (YK) team. We build the Yahoo Knowledge Graph; one of the few web scale knowledge graphs in the world. Our graph contains billions of facts and entities that enrich user experiences and power AI across Verizon Media properties. At the onset of the COVID-19 pandemic we felt the need and responsibility to put our web scale extraction technologies to work, to see how we can help. We have started to extract COVID-19 statistics from hundreds of sources around the globe into what we call the YK-COVID-19 dataset. The YK-COVID-19 dataset provides data and knowledge that help inform our readers on Yahoo News,Yahoo Finance,Yahoo Weather, and Yahoo Search. We created this dataset by carefully combining and normalizing raw data provided entirely by government and public health authorities. We provide website level provenance for every single statistic in our dataset, so our community has the confidence it needs to use it scientifically and report with transparency. After weeks of hard work, we are ready to make this data public in an easily consumable format at the YK-COVID-19-Data GitHub repo.
A dataset alone does not always tell the full story. We reached out to teams across Verizon Media to get their help in building a set of tools that can help us, and you, build dashboards and analyze the data. Engineers from the Verizon Media Data team in Champaign, Illinois volunteered to build an API and dashboard. The API was constructed using a previously published Verizon Media open source platform called Elide. The dashboard was constructed using Ember.js,Leaflet and the Denali design system. We still needed a map tile server and were able to use the Verizon Location Technology team’s map tile service powered by HERE. We leveraged Screwdriver.cd, our open source CI/CD platform to build our code assets, and our open source Athenz.io platform to secure our applications running in our Kubernetes environment. We did this using our open source K8s-athenz-identity control plane project. You can see the result of this incredible team effort today at https://yahoo.github.io/covid-19-dashboard.
Build With Us
You can build applications that take advantage of the YK-COVID-19 dataset and API yourself. The YK-COVID-19 dataset is made available under a Creative Commons CC-BY-NC 4.0 license. Anyone seeking to use the YK-COVID-19 dataset for other purposes is encouraged to submit a request.
Feature Roadmap
Updated multiple times a day, the YK-COVID-19 dataset provides reports of country, state, and county-level data based on the availability of data from our many sources. We plan to offer more coverage, granularity, and metadata in the coming weeks.
Why a Knowledge Graph?
A knowledge graph is information about real world entities, such as people, places, organizations, and events, along with their relations, organized as a graph. We at Yahoo Knowledge have the capability to crawl, extract, combine, and organize information from thousands of sources. We create refined information used by our brands and our readers on Yahoo Finance, Yahoo News, Yahoo Search and others sites too.
We built our web scale knowledge graph by extracting information from web pages around the globe. We apply information retrieval techniques, natural language processing, and computer vision to extract facts from a variety of formats such as html, tables, pdf, images and videos. These facts are then reconciled and integrated into our core knowledge graph that gets richer every day. We applied some of these techniques and processes relevant in the COVID-19 context to help gather information from hundreds of public and government authoritative websites. We then blend and normalize this information into a single combined COVID-19 specific dataset with some human oversight for stability and accuracy. In the process, we preserve provenance information, so our users know where each statistic comes from and have the confidence to use it for scientific and reporting purposes with attribution. We then pull basic metadata such as latitude, longitude, and population for each location from our core knowledge graph. We also include a Wikipedia id for each location, so it is easy for our community to attach additional metadata, as needed, from public knowledge bases such as Wikimedia or Wikipedia.
We’re in this together. So we are publishing our data along with a set of tools that we’re contributing to the open source community. We offer these tools, data, and an invitation to work together on getting past the raw numbers.
Yahoo, Verizon Media, and Verizon Location Technology are all part of the family at Verizon.
ByAshley Wolf, Open Source Program Manager, Verizon Media
In this episode, Gil Yehuda (Sr. Director, Open Source) interviews Mujib Wahab (Sr. Director, Software Dev Engineering) and Henry Avetisyan (Distinguished Software Dev Engineer). Mujib and Henry discuss why Verizon Media open sourced Athenz, a platform for X.509 Certificate-based Service Authentication and Authorization. They also share how others can use and contribute to Athenz.
After being made aware of the COVID-19 Open Research Dataset Challenge (CORD-19), where AI experts have been asked to create text and data mining tools that can help the medical community, the Vespa team wanted to contribute.
Given our experience with big data at Yahoo (now Verizon Media) and creating Vespa (open source big data serving engine), we thought the best way to help was to index the dataset, which includes over 44,000 scholarly articles, and to make it available for searching via Vespa Cloud.
Please expect daily updates to the documentation and query features. Contributions are appreciated - please refer to our contributing guide and submit PRs. You can also download the application, index the data set, and improve the service. More info here on how to run Vespa.ai on your own computer.
Finance charts quickly render hundreds of data points making it seamless to analyze a stock’s performance. Charts are great for people who can see well. Those who are visually impaired often use screen readers. For them, the readers announce the data points in a table format. Beyond a few data points, it becomes difficult for users to create a mental image of the chart’s trend. The audio charts project started with the goal of making Yahoo Finance charts accessible to users with visual impairment. With audio charts, data points are converted to tones with haptic feedback and are easily available through mobile devices where users can switch between tones and spoken feedback.
The idea for the accessible charts solution was first discussed during a conversation between Sukriti Chadha, from the Yahoo Finance team, and Jean-Baptiste Queru, a mobile architect. After building an initial prototype, they worked with Mike Shebanek,Darren BurtonandGary Moulton from the Accessibility team to run user studies and make improvements based on feedback. The most important lesson learned through research and development was that users want a nuanced, customizable solution that works for them in their unique context, for the given product.
Accessible charts were launched on the production versions of the Yahoo Finance Android and iOS apps in 2019 and have since seen positive reception from screen reader users. The open source effort was led by Yatin KaushalandJoao Birk on engineering, Kisiah Timmons on the Verizon Media accessibility team, and Sukriti Chadha on product.
We would love for other mobile app developers to have this solution, adapt to their users’ needs and build products that go from accessible to truly usable. We also envision applications of this approach in voice interfaces and contextual vision limitation scenarios. Open sourcing this version of the solution marks an important first step in this initiative.
To integrate the SDK, simply clone or fork the repository. The UI components and audio conversion modules can be used separately and modified for individual use cases. Please refer to detailed instructions on integration in the README. This library is the Android version of the solution, which can be replicated on iOS with similar logic. While this implementation is intended to serve as reference for other apps, we will review requests and comments on the repository.
We are so excited to make this available to the larger developer community and can’t wait to see how other applications take the idea forward! Please reach out to [email protected] for questions and requests.
In the January Vespa product update, we mentioned Tensor Operations, New Sizing Guides, Performance Improvements for Matched Elements in Map/Array-of-Struct, and Boolean Query Optimizations. This month, we’re excited to share the following updates:
Ranking with LightGBM Models
Vespa now supports LightGBM machine learning models in addition to ONNX, Tensorflow and XGBoost. LightGBM is a gradient boosting framework that trains fast, has a small memory footprint, and provides similar or improved accuracy to XGBoost. LightGBM also supports categorical features.
Matrix Multiplication Performance
Vespa now uses OpenBLAS for matrix multiplication, which improves performance in machine-learned models using matrix multiplication.
Benchmarking Guide
Teams use Vespa to implement applications with strict latency requirements and minimal cost. In January, we released a new sizing guide. This month, we’re adding a benchmarking guide that you can use to find the perfect spot between cost and performance.
Query Builder
Thanks to contributions from yehzu, Vespa now has a fluent library for composing queries - explore the client module for details.
Hadoop Integration
Vespa is integrated with Hadoop and easy to feed from a grid. The grid integration now also supports conditional writes, see #12081.
We welcome your contributions and feedback (tweetoremail) about any of these new features or future improvements you’d like to request.
About Vespa: Largely developed by Yahoo engineers, Vespa is an open source big data processing and serving engine. It’s in use by many products, such as Yahoo News, Yahoo Sports, Yahoo Finance, and the Verizon Media Ad Platform. Thanks to feedback and contributions from the community, Vespa continues to grow.
We’re pleased to announce Proxy Verifier - an open source tool for testing HTTP based proxies. Originally built as part of Verizon Media’s support for Apache Traffic Server (ATS) to improve testability and reliability, Proxy Verifier generates traffic through a proxy and verifies the behavior of the proxy. A key difference between Proxy Verifier and existing HTTP based test tools is Proxy Verifier verifies traffic to and from the proxy. This bi-directional ability was a primary motivation. In addition, handling traffic on both sides of the proxy means a Proxy Verifier setup can run in a network disconnected environment, which was an absolute requirement for this work - no other servers are required, and the risk of hitting production servers with test traffic is eliminated.
After sharing the idea for Proxy Verifier with the Apache Traffic Server community, we’ve received significant external interest. We are pleased to have achieved a level of maturity with the tool’s development that we can now share it with the world by open sourcing it. As a related benefit, by open sourcing Proxy Verifier we will also be able to use it as a part of Traffic Server’s end-to-end test automation.
Within Verizon Media, Proxy Verifier serves to support correctness, production simulation, and load testing. Generated and captured replay files are used for production simulation and load testing. Handbuilt replay files are used for debugging and correctness testing. Replay files are easily constructed by hand based on use cases or packet capture files, and also easily edited and extended later. Proxy Verifier is being integrated into the AuTest framework used in ATS for automated end-to-end testing.
Proxy Verifier builds two executables, the client and server, which are used to test the proxy:
The client sends requests to the proxy under test, which in turn is configured to send them to the server. The server parses the request from the proxy, sends a response, which the proxy then sends to the client. This traffic is controlled by a “replay file”, which is a YAML formatted configuration file. This contains the transactions as four messages - client to proxy, proxy to server, server to proxy, and proxy to client.
Transactions can be grouped into sessions, each of which represents a single connection from the client to the proxy.
This set of events are depicted in the following sequence diagram:
Because the Proxy Verifier server needs only the replay file and no other configuration, it is easy for a developer to use it as a test HTTP server instead of setting up and configuring a full web server.
Other key features:
Fine-grained control of what is sent from the client and server, along with what is expected from the proxy.
Specific fields in the proxy request or response can be checked against one of three criteria: the presence of a field, the absence of a field, or the presence of a field with a specific value.
Transactions in the config can be run once or repeatedly a specified number of times.
Sessions allow control of how much a client session is reused.
Transactions can be sent at a fixed rate to help simulate production level loads. Proxy Verifier has been tested up to over 10K RPS sustained.
The “traffic_dump” plugin for ATS can be used to capture production traffic for later testing with Proxy Verifier.
Protocol support:
IPv4 and IPv6 support.
HTTP/1.x support for both the Verifier client and server.
The Verifier client supports HTTP/2 but the server currently does not. We have plans to support server-side HTTP/2 sometime before the end of Q2 2020.
HTTPS with TLS 1.3 support (assuming Proxy Verifier is linked against OpenSSL 1.1.1 or higher).
For build and installation instructions, explore the github README page. Please file github issues for bugs or enhancement requests.
Acknowledgments
We would like to thank several people whose work contributed to this project:
Syeda “Persia” Aziz, initial work and proof of concept for the replay server.
Jesse Zhang, previous generation prototype and the schema.
Will Wendorf, initial verification logic.
Susan Hinrichs, implemented the client side HTTP/2 support.
ByAshley Wolf, Open Source Program Manager, Verizon Media
In this episode, Gil Yehuda, Sr. Director of Open Source, interviews Joshua Simmons, Vice President, Open Source Initiative (OSI). Joshua discusses the Open Source Initiative (OSI), a global non-profit championing software freedom in society through education, collaboration, and infrastructure. Joshua also highlights trends in the open source landscape and potential future changes.


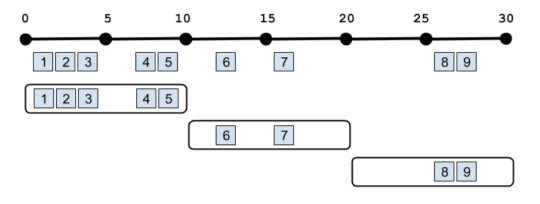
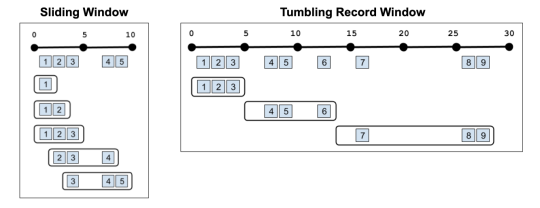
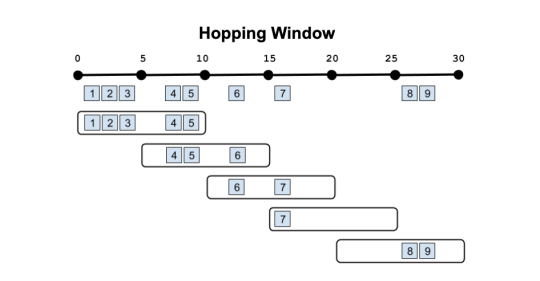
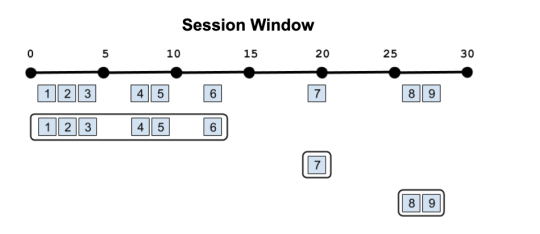
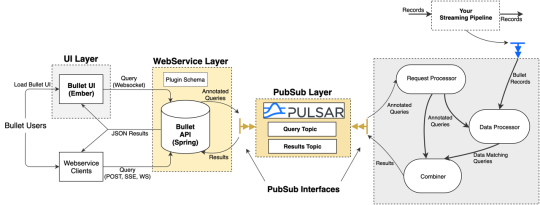
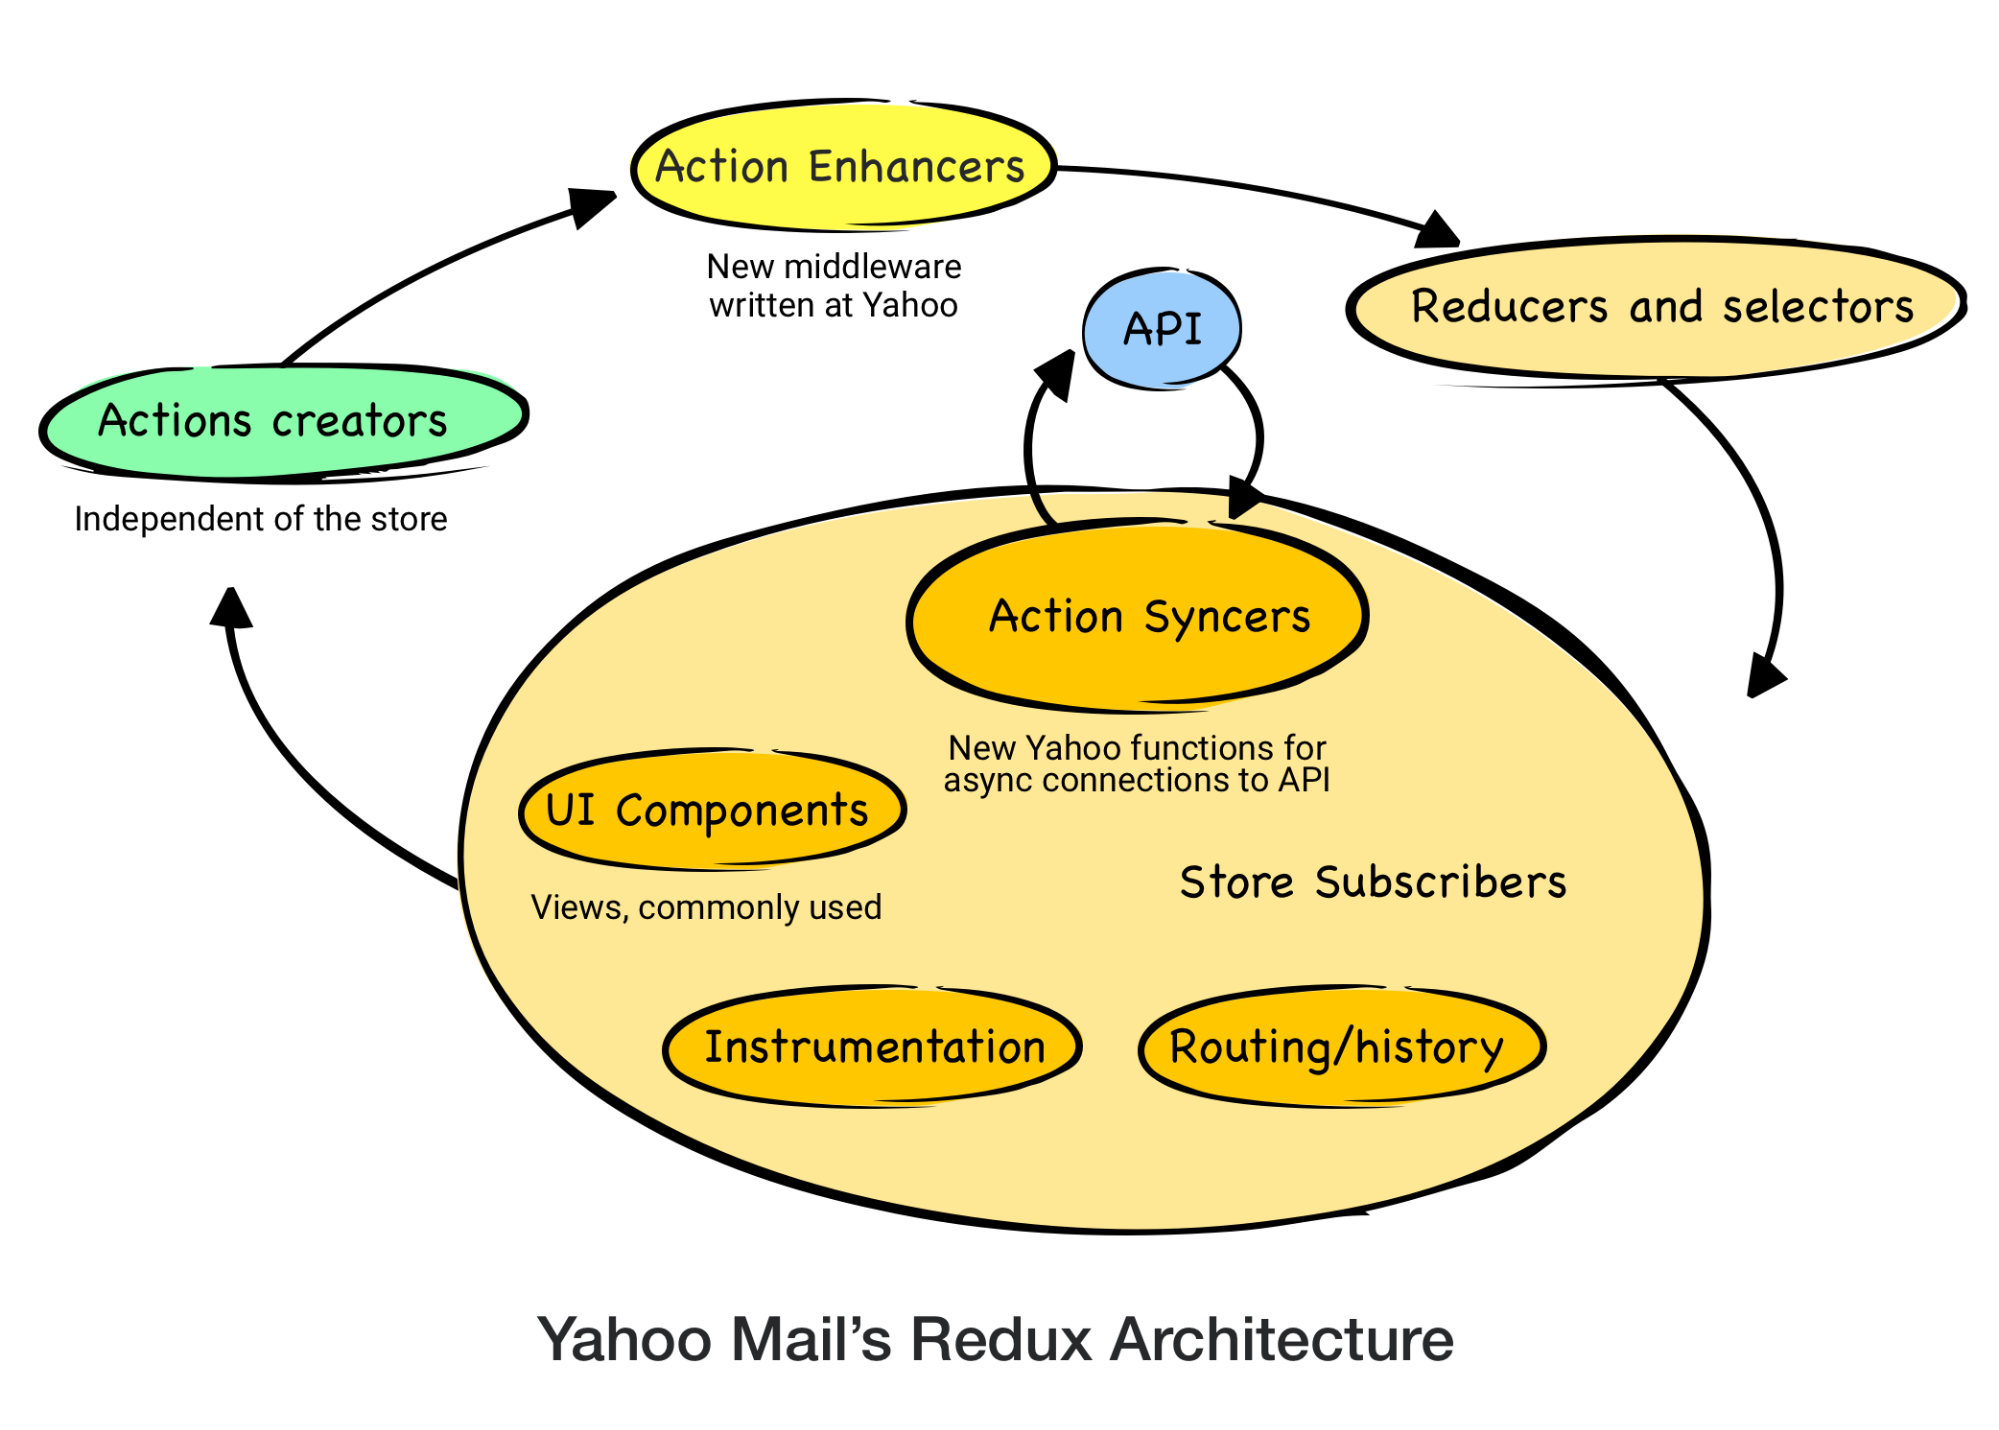

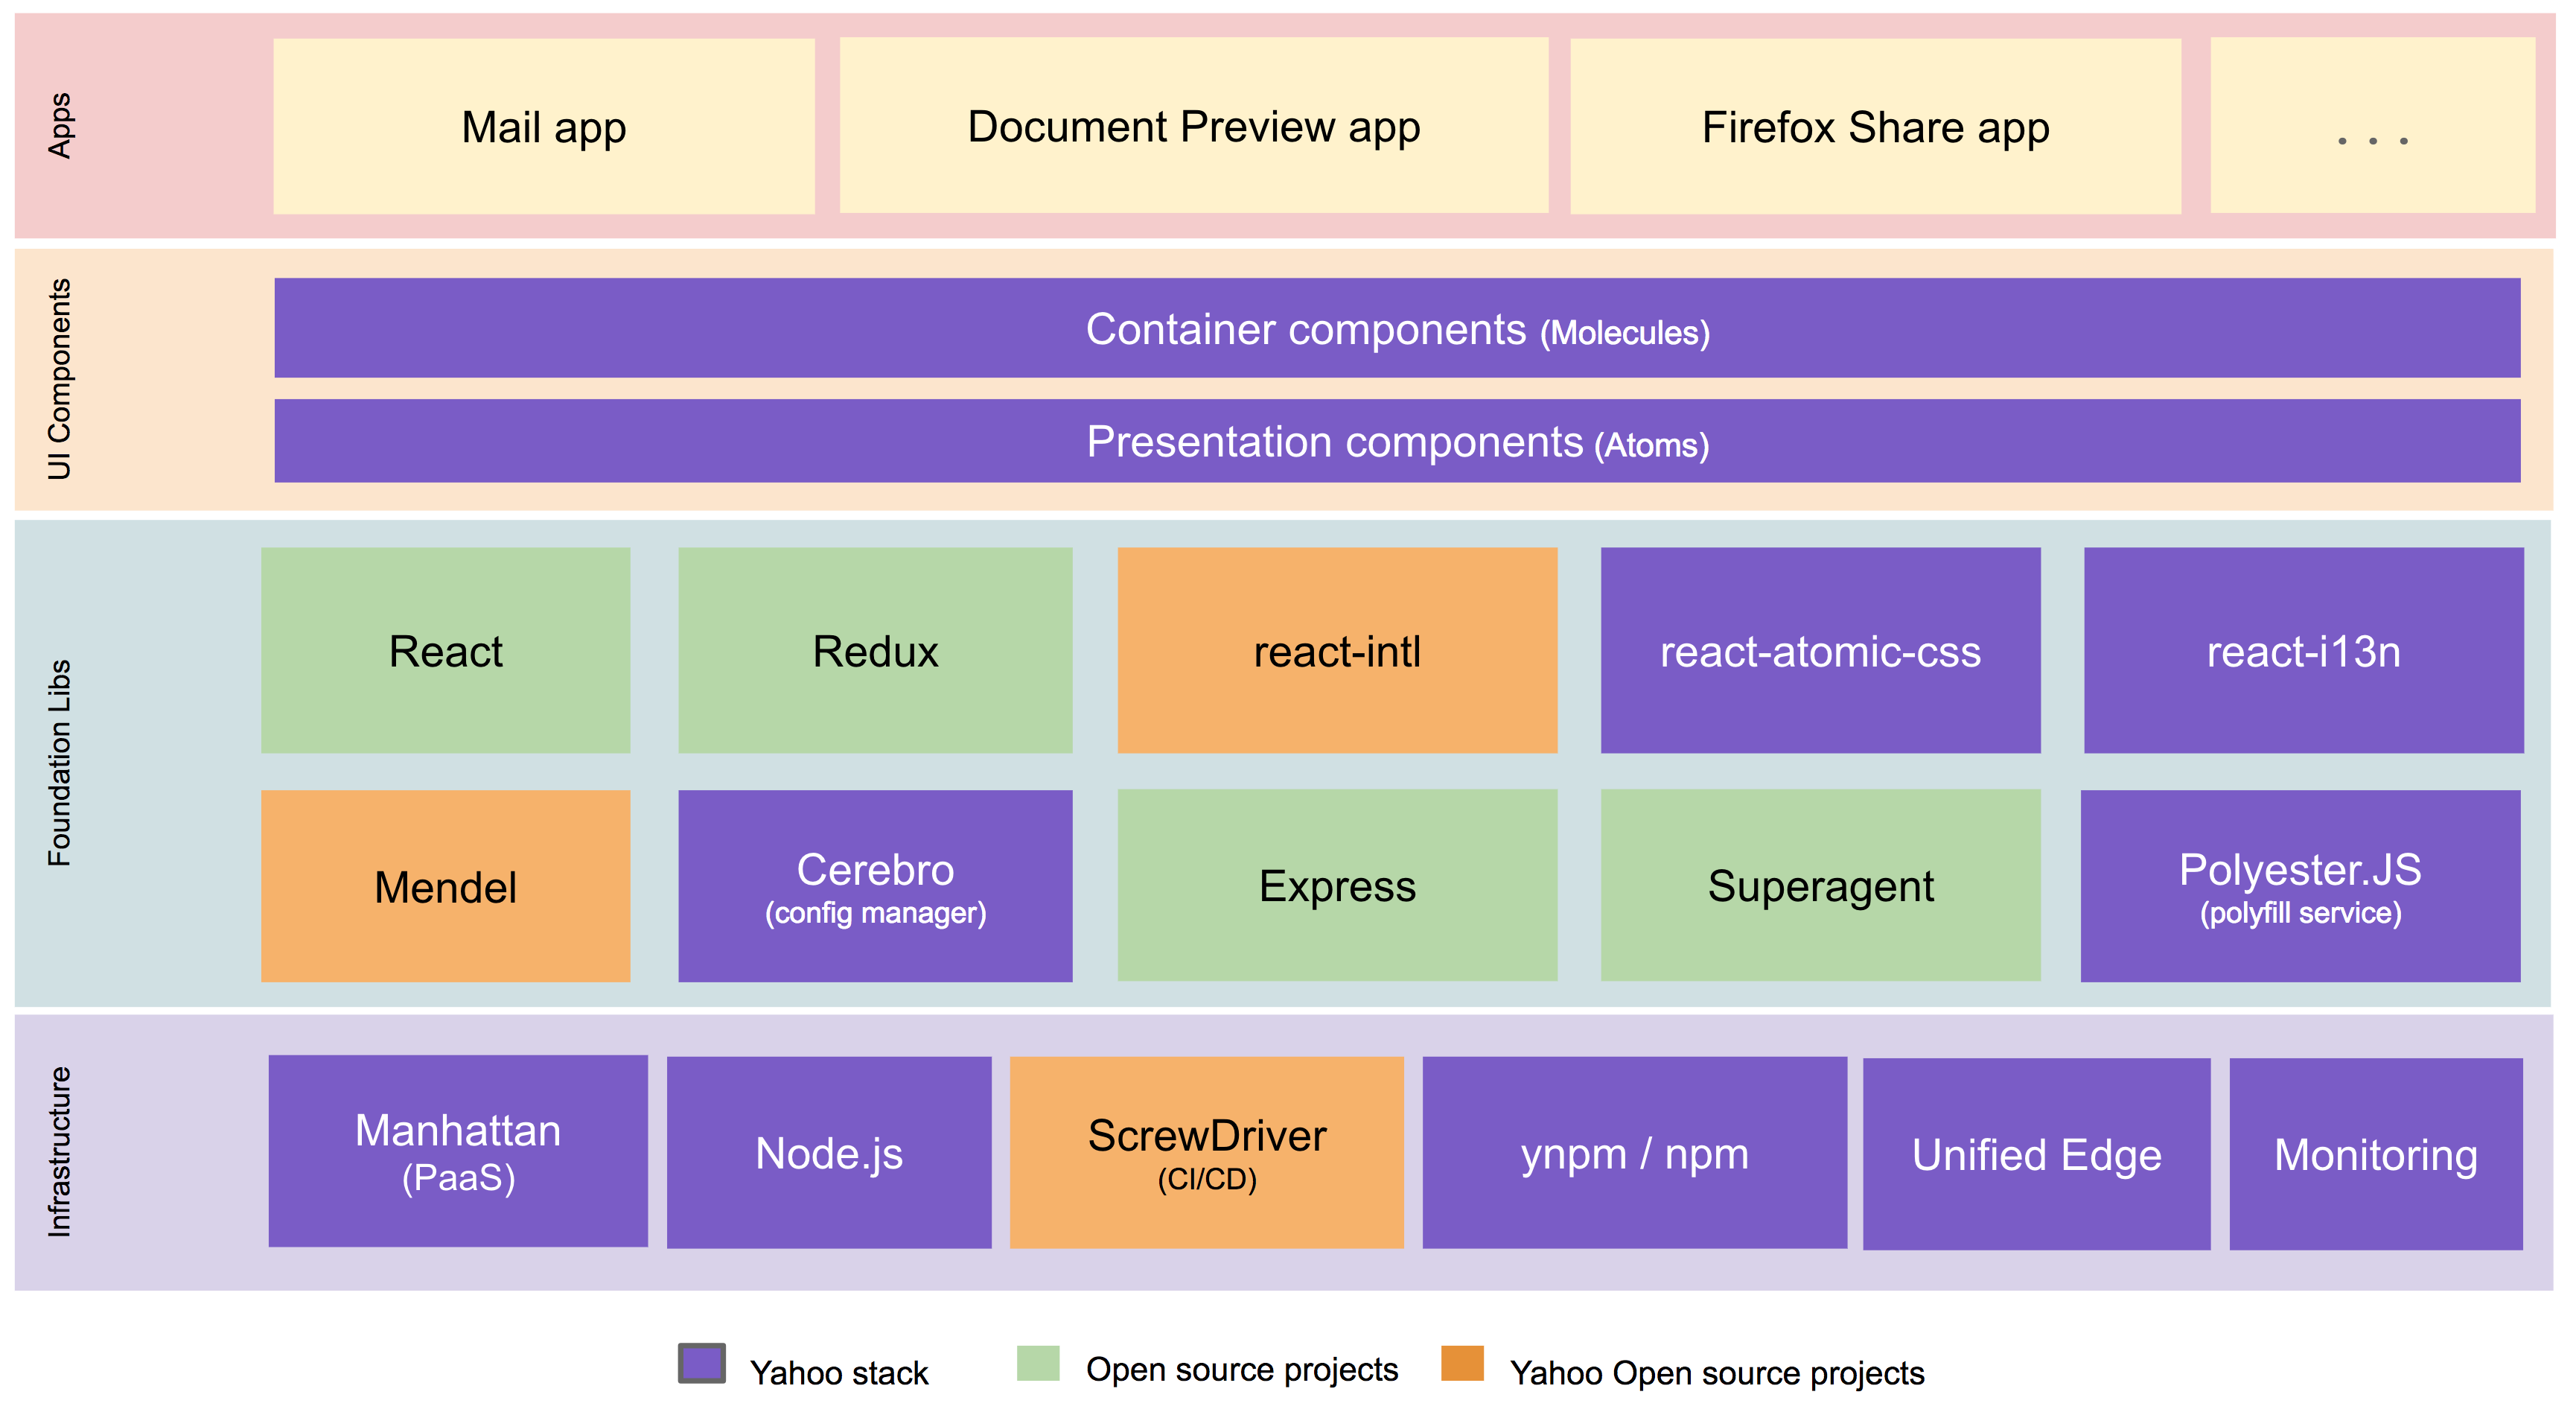

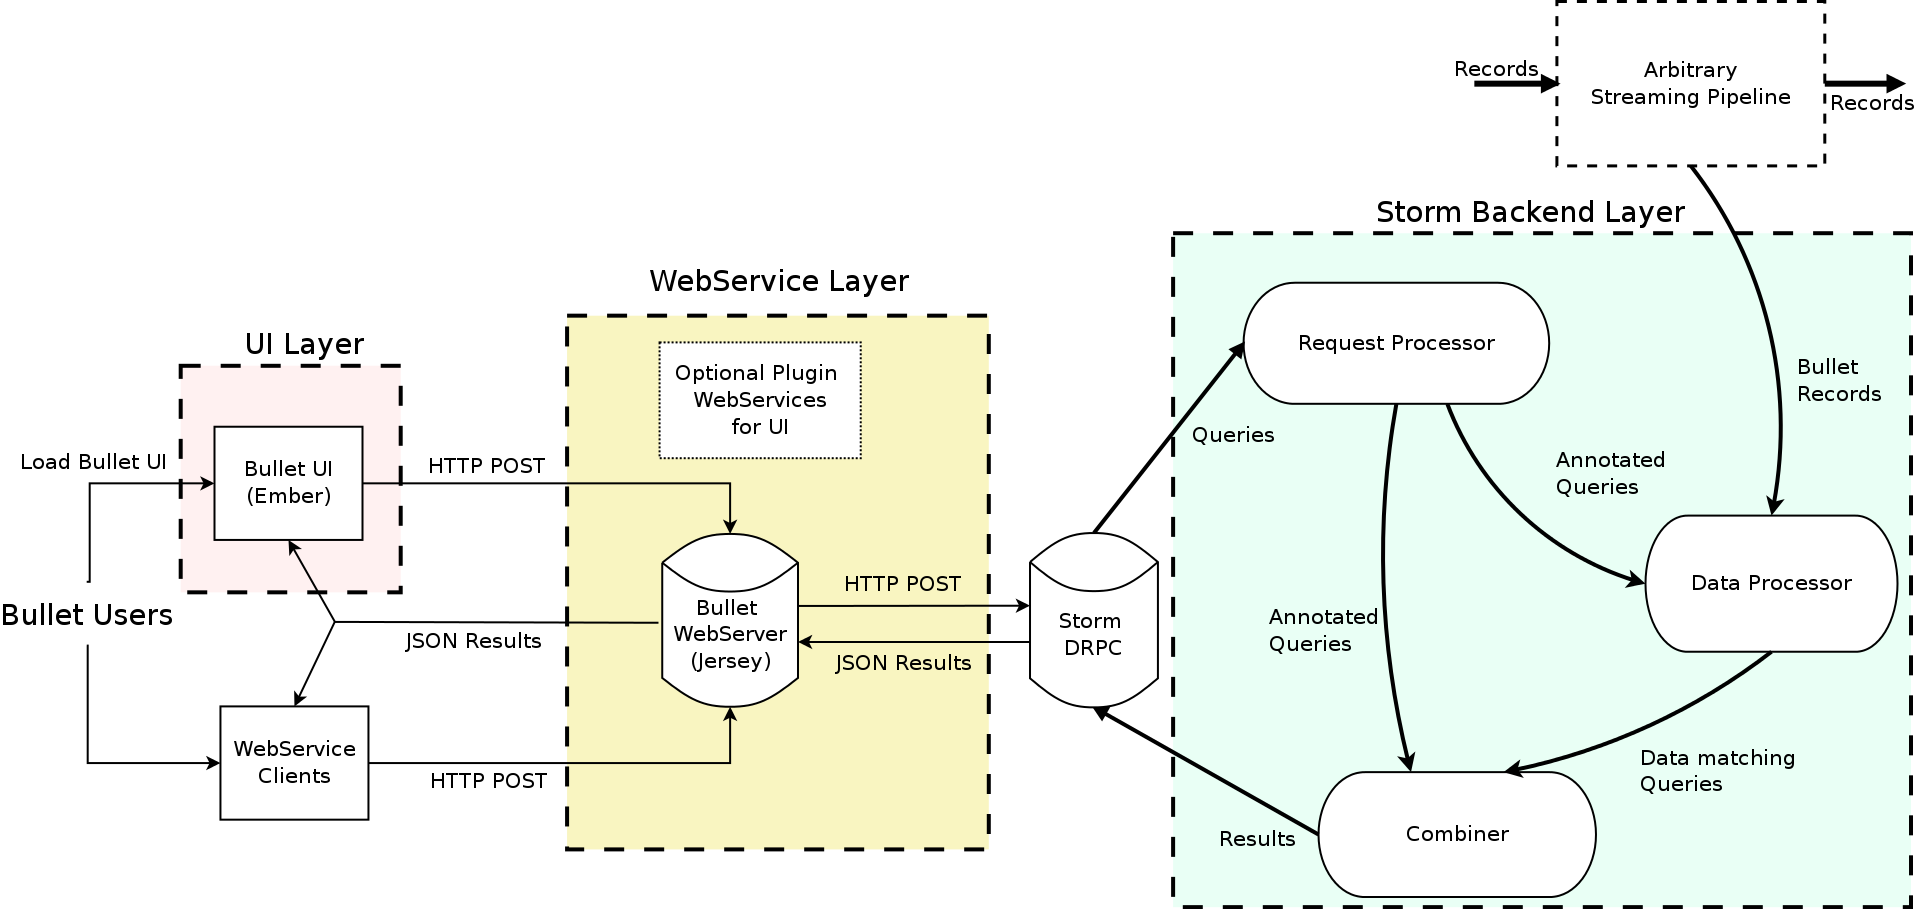


 ALT
ALT ALT
ALT ALT
ALT ALT
ALT ALT
ALT ALT
ALT ALT
ALT