Hello everyone! Today I wanted to just pop in with a quick post about collecting data for your Craft. This can help you keep track of things, and you can learn interesting things from it (what kind of crystal do you own the most of? what percentage of spirits that you have worked with are of some particular species? etc). Playing with data is fun! I hope to do more on what to do with this data in…
Design survey questionnaire for factor analysis (I’m doing a research study to determine why so few math students are using online tutoring at my institution)
Get approval from Institutional Research department to deploy my survey
Diddle around with Tableau (I want to build a faculty-facing data dashboard breaking down tutoring utilization at my institution)
Y’all, I think I’m doing it! I think I’m growing into a baby data scientist!
I think that, for me, part of the appeal of data analytics / data science is the aspect of seeking structure in chaos. My executive functioning skills have been especially suffering during work-from-home times, but my graduate studies are helping me build the skills to take the chaos and disorder and translate it into an organized format that can then be analyzed, optimized, and used to better-understand the big picture.
Since I’m still floating around in survive-then-thrive mode, I don’t yet have the time to put together any helpful tips for others to consider; however, doing so is ultimately my major goal for this blog. Some topics I’ve already been learning and hope to address soon via new content are:
Identifying reliable research via 6 key characteristics
Building a strong hypothesis for a research study
Designing effective research methods
Understanding key concepts in beginner database management and design
Skills I haven’t learned yet but eventually want to share:
Ya know, in this day and age I’m extraglad to be going into a field that’s all about evidence-based decision making. Until now, I never really thought about my grad focus (business analytics / data science) in the context of current events, but now that I am, it seems fitting.
My first assignment in one of my classes is all about evaluating the quality/reliability of research — a skill I began to develop in high school but lost strength in over time. I’ve almost certainly been guilty of accidentally sharing misinformation via unfounded claims and weak research studies because social media makes it too darn easy to pass info along without a second thought. All this to say that I’m glad I’ll be more equipped to hold myself accountable for thinking critically about information before passing it along to others.
Great article, please read it. Be wary of data without context. Always.
✅Numbers aren’t facts. They’re the result of a lot of subjective choices that have to be documented transparently and in detail before you can even begin to consider treating the output as fact.
The fanfiction community is huge and growing. It’s an intricate network of authors, reviewers, and readers contributing to the creation of some form of contemporary culture.
At the University of Washington, we are a group of researchers studying the fanfiction community and exploring the informal learning taking place there.
We were particularly interested in authors who are user-favorites on Fanfiction.Net. When a user favorites an author, there are certain characteristics of the author that the user finds intriguing. It could be that the story is very interesting or the style of writing of the author fascinates the reader. We aim to find which authors have been favorited the most and what factors correlate with a user favoriting an author.
This blog post explores the connection between users (in a particular fandom) and the authors that they have favorited on FanFiction.net. We us a metric to measure this relationship and try to find out how it correlates to other factors such as:
Number of stories and chapters published by the authors
Number of reviews received for the published stories
Total number of words written by the author
Number of favorites received
In our analysis below, we have used the PageRank algorithm on authors in the “Game of Thrones” fandom on Fanfiction.net. Each author has at least one favorite author, and we have exploited this detail for our analysis.
Motivation
Both of us are huge Game of Thrones fans. The exciting season 8 finale and the massive popularity of GoT on social media motivated us to explore this fandom. Our current goal is to analyze authors that have been favorited by users, and which features might have earned them favorites in the GoT fandom on Fanfiction.net. This analysis can pave the way for building a recommendation engine for users on Fanfiction.net.
Dataset
Our dataset has been scraped from Fanfiction.net. For the analysis, we used two primary tables - Story and Author_favorites. The ‘Story’ table contains data about the stories - including but not limited to a unique story identifier, user id, fandom id, number of reviews, number of followers, and so on. The ‘Author_favorites’ table contains data about the users and their favorited authors. Because the data in these tables were humongous, we limited our scope to the Game of Thrones fandom. We used a cluster of the data by only retrieving the data that consisted of stories written in the “Game of Thrones” fandom.
The dataset we used was formed by combining the User Favorite table, Fandom table, and Stories table. This gave us a table consisting of User IDs and their Favorited Author IDs, both belonging to the Game of Thrones fandom on Fanfiction.net.
Method and Process
PageRank is a billion-dollar algorithm which made Google what it is. Whilst the most popular application of PageRank is web search, it can be exploited in other areas as well. The web is a gigantic graph interconnected by the web links. And PageRank assigns a score of importance by calculating the ‘inlinks’ to a website. In our case, we have considered the dataset of users and their favorited authors as a form of a graph: Many users favorite authors and these users could be authors themselves who have been favorited by other users. Hence, every author will have none, one or more users who favorite them. And thus we can assign a score of ‘connectedness’ to the authors by using PageRank.
A visual representation of the graph is shown below. The blue dot at the center represents a user and the yellow dots represent the favorited users as well as the favorited users who have favorited other favorited users! When there are no out-links, the graph stops traversing.
Fig 1. Network of a user (of highest pagerank) and his/her favorite authors. Blue dot represents the user with highest PageRank and yellow dots are favorited authors
This graph shows the ‘connectedness’ amongst fanfiction authors. Now we attempt to determine which characteristics (features) have a good correlation with the PageRank score that we obtained. In simple words, we try to find out how closely related the PageRank score is with characteristics such as ‘number of reviews’, ‘total words written by the author’ and so on. How can this be done?
A simple way to do this is through Linear Regression. In linear regression, we plot the features against a single response and try to explain the relationship through a straight line. We are conducting our regression analysis by using metrics which depict an author’s output (quantity):
Total words written by authors
Number of stories and chapters published by the author
And those depicting the recognition received (quality) by the author in the form of:
Number of reviews received
Number of times the author’s stories have been favorited
The intuition behind our analysis is to discern if there is any correlation between the PageRank scores which is obtained through network analysis and the above-mentioned metrics.
Findings and Results
PageRank Distribution
The histogram below shows the distribution of PageRank scores. As expected the histogram follows the Power Law which means a small number of items are having high page rank scores while the majority of items is concentrated towards minimum scores.
Due to the nature of our distribution, we decided to strip off all the authors having a score above 0.5, as clearly they are outliers and may not represent how the majority of the community behaves. In fact, there is a possibility of authors with high page rank scores skewing our results.
Regression Analysis
The graph below shows a plot of PageRank score against total words and the line denotes the amount of correlation between the two. A positive slope indicates a positive correlation. Please note that even a slight increase in the PageRank makes a big difference. We can safely discern that as the authors increase their output, their score improves.
The second metric we used to measure an author’s output is Story-Chapter product which is the number of stories multiplied by the number of chapters. The reasoning behind multiplying both is that author adopt different styles for structuring their content. One author may have a story with multiple chapters, another one may write multiple stories with one chapter each. The plot below depicts positive correlation yet again.
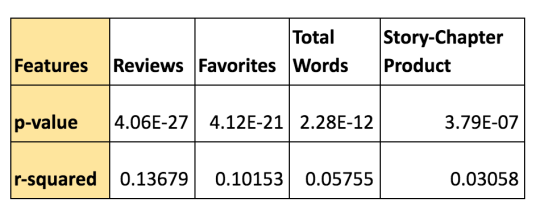
Running regression over other variables yields the following output:
Our initial assumptions were correct and the features we selected are all indicators of a good PageRank score. However, which one of these is the best predictor?
Enter p-value. P-value helps to determine the level of significance of our results. In statistics, a p-value <0.05 typically indicates the trend is statistically significant. P-value only helps to infer significance which means all the variables we included in our study are important predictors for the page rank score. What p-value does tell us is how important these variables. To know which feature is better predictor, we use another metric called r-square. R-square helps to know the degree of correlation between two expected output and the actual output. It is conceived in terms of percentage.
The p-values obtained for the above features are as follows:
Based on our analysis, it’s safe to conclude the number of reviews received by the author indicates a higher probability of that author being favorited often.
Conclusion
In our analysis, we used four features, two of which Total Words and Story-Chapter product indicate the output (quantity) of an author while the other two; the number of reviews received and number of times the author’s works have been favorited indicate the quality of an author’s work. These features have been plotted against the page rank score which indicates the degree of an author’s presence in the community. Through data science and statistical analysis, we were able to discern that the quality of works and feedback received by an author is a better indicator than the output.
Future Work
Our analysis can help pave the way for a recommendation engine for new users. This recommendation engine would leverage the PageRank algorithm to recommend authors to a user which he/she would most likely favorite. Just like Google and Amazon recommend products to users, our recommendation engine would suggest authors for users depending on the fandom they like. To build a recommendation engine as effective as Google or Amazon would require tons of optimization and fine-tuning, hence we have kept this as future work for this project.
As for fanfiction enthusiasts ourselves, we want to connect with the community so that they can help us in our analysis. Inputs from the community are always encouraged as this would help us make a better recommendation engine. So please comment on your views on the following questions:
What would you like to see recommended? We aim to recommend the Authors, but are open to suggestions!
What parameters do you think would affect the action of a user favoriting an author? Do you think it’s just the story or could it be the number of reviews, genre or style of writing? Comment below! Our analysis indicates the number of reviews, however, it will be interesting to see if our analysis is aligning with what the community thinks.
The goal of this research is to find further evidence for the benefits of distributed mentoring. Distributed mentoring is “a kind of mentoring that is uniquely suited to networked communities, where people of all ages and experience levels engage with and support one another through a complex, interwoven tapestry of interactive, cumulatively sophisticated advice and informal instruction” [1]. This involves multiple kinds of feedback exchanged between many mentors and mentees. In this research project, we used machine learning to classify Fanfiction.net reviews by their category within distributed mentoring theory.
Earlier research in our group published in the paper ‘More Than Peer Production: Fanfiction Communities as Sites of Distributed Mentoring’ has outlined 13 categories that were observed in Fanfiction.net reviews [2]. We used shallow positive, targeted positive, targeted constructive, and targeted positive & constructive for this analysis, as they are the four mutually exclusive codes. Table 1 below provides a formal description and percentage of reviews for each of the categories [2].
Table 1: Description and Percentage of Categories (based on 4500 reviews)
(Note: percentages add up to more than 100% because a review could be in multiple categories).
An example of a shallow positive review is “Great story!”, targeted positive is “I loved the character development of James”, and a targeted constructive review is “You could have described the battle scene better!” Targeted positive & constructive reviews contains both targeted positive and targeted constructive comments.
Our overarching research question is “Do certain review categories correlate with various attributes of distributed mentoring?” For example, we want to explore whether substantive, targeted reviews improve authors’ writing. This research would be beneficial to the fanfiction community, as it would provide an outline to members of the community on how to effectively impact and interact with authors. The theory of distributed mentoring is an applicable framework to use, as it discusses the effect of networked communities. To apply this theory, we used the public reviews available in the fanfiction community. Since there are numerous types of reviews, we used the codes listed in Table 1 to classify the reviews.
To classify all Fanfiction.net reviews, roughly 177 million, we explored machine learning classification, as manual coding would be impossible. Classification is a process of predicting the review category for a given set of reviews.
Our goal for this blog was to find the best machine learning model for review classification. We could then use this model to expand our results to the entire Fanfiction.net reviews dataset. Our baseline classification tool was ALOE (Affect Labeler of Expressions), an open source tool developed to train and test machine learning classifiers to automatically label chat messages with different emotion or affect categories [3]. In addition, we attempted various algorithms such as logistic regression, support vector machines, and Naive Bayes. This blog post discusses our approach to running ALOE as well as creating each of the aforementioned machine learning models.
Dataset
To conduct machine classification, we required data to train the model to learn how reviews relate to a certain category. We leveraged a dataset manually classified by previous participants in the UW Human-Centered Data Science Lab research group. Our dataset contained ~8000 manually classified reviews.
Method
The measures of success for performance were accuracy, precision, and recall. Accuracy is the number of correct predictions. This measure, however, can be misleading in classification problems. In the field of data science, we call a positive value true and a negative value false. In this case the value is positive if the review corresponds to the category in question and false otherwise. For example, if a dataset has 99 positive data points and 1 negative data points, a model that predicts only positive would receive a 0.99 accuracy. Therefore, we also used precision and recall to provide a holistic perspective. Precision is ‘how many negative data points did I include in my list of positively predicted examples’, and recall is ‘how many positive data points did I miss’. An average range for precision and recall is 0.6 - 0.7. Anything below 0.6 may signify that the results are not valid while and anything above 0.7 is generally considered a really good score that validates our accuracy.
Figure 1: Image from Wikipedia visually describing Precision and Recall
Logistic Regression is a method commonly used when the inputs of the model are categories. We experimented with multiple different parameters and sought a set of parameters that yield the best result from the model.
2.2 Naive Bayes
Naive Bayes is a family of machine learning based on applying Bayes’ theorem to calculate certain probabilities. We explored 3 types of Naive Bayes classifiers on the four categories of data. These were the Gaussian, Bernoulli and Multinomial Naive Bayes methods.
2.3 Support Vector Machine (SVM)
SVM is a method to find the best division between two classes. We explored three different SVM models: default, linear, and optimal. We used a technique to find the best parameters for each of these models.
When using the four categories defined above, we received low precision and recall scores for targeted constructive and targeted positive & constructive. Hence we decided to combine the three targeted categories in order to solidify our results. This is because there are very few reviews in the dataset for the latter two categories, and all targeted categories qualify as “substantive” since they provide specific feedback to authors. Consequently, we decided to add the update encouragement category, as 27.6% of our dataset is classified as this code. Update encouragement is a category that represents all reviews that encourage the author to write more [2]. These changes enable a more accurate comparison between the various models.
Results
After these changes, we got the following results for our models on shallow positive, targeted, and update encouragement. All values are representative of percentages, from a scale from 0 to 1.
Conclusion
We will expand these results by classifying the entire Fanfiction.net dataset, 177 million reviews, by using Optimal SVM to predict shallow positive and update encouragement reviews and ALOE to predict targeted reviews. After which, we plan to proceed with our analysis between these review categories and attributes of distributed mentoring such as improvement of writing and participation rate. As a starting point, we will explore whether targeted reviews impact authors’ lexical diversity - which is an indicator of improvement in the authors’ writing and a learning gain from online informal learning. Additionally, we will brainstorm other metrics to measure learning and distributed mentoring. Overall, we are delighted that our changes gave positive results and were able to create models that performed better than our baseline, ALOE. A better model means we can more accurately classify reviews and expand our results to provide a blueprint to the fanfiction community on how to effectively impact and interact with authors.
Evans, S., Davis, K., Evans, A., Campbell, J. A., Randall, D. P., Yin, K., & Aragon, C. (2017, February). More than peer production: fanfiction communities as sites of distributed mentoring. In Proceedings of the 2017 ACM Conference on Computer Supported Cooperative Work and Social Computing(pp. 259-272). ACM.
Hello fanfic friends! In the past few months, our research group has done several research projects about fanfiction communities. We have written our research results into a collection of blog posts. Starting this week, we are going to post once a week to share our findings. Stay turned for more posts!!!
The goal of this research is to find further evidence for the benefits of distributed mentoring. Distributed mentoring is “a kind of mentoring that is uniquely suited to networked communities, where people of all ages and experience levels engage with and support one another through a complex, interwoven tapestry of interactive, cumulatively sophisticated advice and informal instruction” [1]. This involves multiple kinds of feedback exchanged between many mentors and mentees. In this research project, we used machine learning to classify Fanfiction.net reviews by their category within distributed mentoring theory.
Earlier research in our group published in the paper ‘More Than Peer Production: Fanfiction Communities as Sites of Distributed Mentoring’ has outlined 13 categories that were observed in Fanfiction.net reviews [2]. We used shallow positive, targeted positive, targeted constructive, and targeted positive & constructive for this analysis, as they are the four mutually exclusive codes. Table 1 below provides a formal description and percentage of reviews for each of the categories [2].
Table 1: Description and Percentage of Categories (based on 4500 reviews)
(Note: percentages add up to more than 100% because a review could be in multiple categories).
An example of a shallow positive review is “Great story!”, targeted positive is “I loved the character development of James”, and a targeted constructive review is “You could have described the battle scene better!” Targeted positive & constructive reviews contains both targeted positive and targeted constructive comments.
Our overarching research question is “Do certain review categories correlate with various attributes of distributed mentoring?” For example, we want to explore whether substantive, targeted reviews improve authors’ writing. This research would be beneficial to the fanfiction community, as it would provide an outline to members of the community on how to effectively impact and interact with authors. The theory of distributed mentoring is an applicable framework to use, as it discusses the effect of networked communities. To apply this theory, we used the public reviews available in the fanfiction community. Since there are numerous types of reviews, we used the codes listed in Table 1 to classify the reviews.
To classify all Fanfiction.net reviews, roughly 177 million, we explored machine learning classification, as manual coding would be impossible. Classification is a process of predicting the review category for a given set of reviews.
Our goal for this blog was to find the best machine learning model for review classification. We could then use this model to expand our results to the entire Fanfiction.net reviews dataset. Our baseline classification tool was ALOE (Affect Labeler of Expressions), an open source tool developed to train and test machine learning classifiers to automatically label chat messages with different emotion or affect categories [3]. In addition, we attempted various algorithms such as logistic regression, support vector machines, and Naive Bayes. This blog post discusses our approach to running ALOE as well as creating each of the aforementioned machine learning models.
Dataset
To conduct machine classification, we required data to train the model to learn how reviews relate to a certain category. We leveraged a dataset manually classified by previous participants in the UW Human-Centered Data Science Lab research group. Our dataset contained ~8000 manually classified reviews.
Method
The measures of success for performance were accuracy, precision, and recall. Accuracy is the number of correct predictions. This measure, however, can be misleading in classification problems. In the field of data science, we call a positive value true and a negative value false. In this case the value is positive if the review corresponds to the category in question and false otherwise. For example, if a dataset has 99 positive data points and 1 negative data points, a model that predicts only positive would receive a 0.99 accuracy. Therefore, we also used precision and recall to provide a holistic perspective. Precision is ‘how many negative data points did I include in my list of positively predicted examples’, and recall is ‘how many positive data points did I miss’. An average range for precision and recall is 0.6 - 0.7. Anything below 0.6 may signify that the results are not valid while and anything above 0.7 is generally considered a really good score that validates our accuracy.
Figure 1: Image from Wikipedia visually describing Precision and Recall
Logistic Regression is a method commonly used when the inputs of the model are categories. We experimented with multiple different parameters and sought a set of parameters that yield the best result from the model.
2.2 Naive Bayes
Naive Bayes is a family of machine learning based on applying Bayes’ theorem to calculate certain probabilities. We explored 3 types of Naive Bayes classifiers on the four categories of data. These were the Gaussian, Bernoulli and Multinomial Naive Bayes methods.
2.3 Support Vector Machine (SVM)
SVM is a method to find the best division between two classes. We explored three different SVM models: default, linear, and optimal. We used a technique to find the best parameters for each of these models.
When using the four categories defined above, we received low precision and recall scores for targeted constructive and targeted positive & constructive. Hence we decided to combine the three targeted categories in order to solidify our results. This is because there are very few reviews in the dataset for the latter two categories, and all targeted categories qualify as “substantive” since they provide specific feedback to authors. Consequently, we decided to add the update encouragement category, as 27.6% of our dataset is classified as this code. Update encouragement is a category that represents all reviews that encourage the author to write more [2]. These changes enable a more accurate comparison between the various models.
Results
After these changes, we got the following results for our models on shallow positive, targeted, and update encouragement. All values are representative of percentages, from a scale from 0 to 1.
Conclusion
We will expand these results by classifying the entire Fanfiction.net dataset, 177 million reviews, by using Optimal SVM to predict shallow positive and update encouragement reviews and ALOE to predict targeted reviews. After which, we plan to proceed with our analysis between these review categories and attributes of distributed mentoring such as improvement of writing and participation rate. As a starting point, we will explore whether targeted reviews impact authors’ lexical diversity - which is an indicator of improvement in the authors’ writing and a learning gain from online informal learning. Additionally, we will brainstorm other metrics to measure learning and distributed mentoring. Overall, we are delighted that our changes gave positive results and were able to create models that performed better than our baseline, ALOE. A better model means we can more accurately classify reviews and expand our results to provide a blueprint to the fanfiction community on how to effectively impact and interact with authors.
Evans, S., Davis, K., Evans, A., Campbell, J. A., Randall, D. P., Yin, K., & Aragon, C. (2017, February). More than peer production: fanfiction communities as sites of distributed mentoring. In Proceedings of the 2017 ACM Conference on Computer Supported Cooperative Work and Social Computing(pp. 259-272). ACM.
Amit Nagpal, Sr. Director, Software Development Engineering, Verizon Media
Among many interesting teams at Verizon Media is the Yahoo Knowledge (YK) team. We build the Yahoo Knowledge Graph; one of the few web scale knowledge graphs in the world. Our graph contains billions of facts and entities that enrich user experiences and power AI across Verizon Media properties. At the onset of the COVID-19 pandemic we felt the need and responsibility to put our web scale extraction technologies to work, to see how we can help. We have started to extract COVID-19 statistics from hundreds of sources around the globe into what we call the YK-COVID-19 dataset. The YK-COVID-19 dataset provides data and knowledge that help inform our readers on Yahoo News,Yahoo Finance,Yahoo Weather, and Yahoo Search. We created this dataset by carefully combining and normalizing raw data provided entirely by government and public health authorities. We provide website level provenance for every single statistic in our dataset, so our community has the confidence it needs to use it scientifically and report with transparency. After weeks of hard work, we are ready to make this data public in an easily consumable format at the YK-COVID-19-Data GitHub repo.
A dataset alone does not always tell the full story. We reached out to teams across Verizon Media to get their help in building a set of tools that can help us, and you, build dashboards and analyze the data. Engineers from the Verizon Media Data team in Champaign, Illinois volunteered to build an API and dashboard. The API was constructed using a previously published Verizon Media open source platform called Elide. The dashboard was constructed using Ember.js,Leaflet and the Denali design system. We still needed a map tile server and were able to use the Verizon Location Technology team’s map tile service powered by HERE. We leveraged Screwdriver.cd, our open source CI/CD platform to build our code assets, and our open source Athenz.io platform to secure our applications running in our Kubernetes environment. We did this using our open source K8s-athenz-identity control plane project. You can see the result of this incredible team effort today at https://yahoo.github.io/covid-19-dashboard.
Build With Us
You can build applications that take advantage of the YK-COVID-19 dataset and API yourself. The YK-COVID-19 dataset is made available under a Creative Commons CC-BY-NC 4.0 license. Anyone seeking to use the YK-COVID-19 dataset for other purposes is encouraged to submit a request.
Feature Roadmap
Updated multiple times a day, the YK-COVID-19 dataset provides reports of country, state, and county-level data based on the availability of data from our many sources. We plan to offer more coverage, granularity, and metadata in the coming weeks.
Why a Knowledge Graph?
A knowledge graph is information about real world entities, such as people, places, organizations, and events, along with their relations, organized as a graph. We at Yahoo Knowledge have the capability to crawl, extract, combine, and organize information from thousands of sources. We create refined information used by our brands and our readers on Yahoo Finance, Yahoo News, Yahoo Search and others sites too.
We built our web scale knowledge graph by extracting information from web pages around the globe. We apply information retrieval techniques, natural language processing, and computer vision to extract facts from a variety of formats such as html, tables, pdf, images and videos. These facts are then reconciled and integrated into our core knowledge graph that gets richer every day. We applied some of these techniques and processes relevant in the COVID-19 context to help gather information from hundreds of public and government authoritative websites. We then blend and normalize this information into a single combined COVID-19 specific dataset with some human oversight for stability and accuracy. In the process, we preserve provenance information, so our users know where each statistic comes from and have the confidence to use it for scientific and reporting purposes with attribution. We then pull basic metadata such as latitude, longitude, and population for each location from our core knowledge graph. We also include a Wikipedia id for each location, so it is easy for our community to attach additional metadata, as needed, from public knowledge bases such as Wikimedia or Wikipedia.
We’re in this together. So we are publishing our data along with a set of tools that we’re contributing to the open source community. We offer these tools, data, and an invitation to work together on getting past the raw numbers.
Yahoo, Verizon Media, and Verizon Location Technology are all part of the family at Verizon.
After being made aware of the COVID-19 Open Research Dataset Challenge (CORD-19), where AI experts have been asked to create text and data mining tools that can help the medical community, the Vespa team wanted to contribute.
Given our experience with big data at Yahoo (now Verizon Media) and creating Vespa (open source big data serving engine), we thought the best way to help was to index the dataset, which includes over 44,000 scholarly articles, and to make it available for searching via Vespa Cloud.
Please expect daily updates to the documentation and query features. Contributions are appreciated - please refer to our contributing guide and submit PRs. You can also download the application, index the data set, and improve the service. More info here on how to run Vespa.ai on your own computer.
Every day at Glow, we feel like proud mamas and papas. Our apps support women from period to parenting—they’ve helped millions of women better understand their bodies, and over two hundred thousand women get pregnant!
Today, we are especially proud: Glow has been chosen as one of five organizations to integrate with Apple’s new CareKit! As Apple’s early launch partner, we’ll be incorporating CareKit into not one, but TWO apps in the coming weeks. The Glow NurtureandGlow Baby apps are in for a first-class fabulous time.
Pushing the boundaries of health via technology is in our DNA: We were the first women’s health app to focus on male fertility, postpartum support, and the interdependence of period tracking and sexual health. Now we’re in the very first batch of organizations integrating with Apple CareKit. Tracking your health and the health of your loved ones is about to be even more intuitive in our apps! Just you wait and see, moms and moms-to-be :)
Glow is 2! That’s right. We just had a big b-day. There was cake cake cake. And while riding the sugar high, we took a deep dive into our epic data set to see what we could find.
Turns out, we’ve collected a lot of interesting tidbits! We just had to spill. Et voilà—check out what we can show the world after two years of getting it on :)
Women drink. 60% of all U.S. women, and over 75% of women on Glow, to be precise. Drinking is fun. Sex is too! Sometimes they combine to make a great cocktail, but other times, not so much. What’s the best recipe to combine the two?
Sex and drinking have been in the news a lot recently — and haters and lamer sections of society love nothing more than blaming women when sex and drinking go south. Women are told that any dicey sexual encounter that happens under the influence is “our fault,” that dressing more conservatively and not staying out late will help keep us safe.
None of that BS is true. Alcohol may sometimes be a factor in sexual assault cases; it is never the “cause” — and it is never, ever a woman’s fault when she is sexually assaulted, no matter her BAC.
We’re committed to changing the conversation around alcohol and sex. So we took a deep dive into our Glow data to investigate. This is what we learned.


follow me or @im_productive on insta for more content like t")
follow me or @im_productive on insta for more content like t")


