#uwmdistcoll


This map is one of my top ten favorite! Map of Southern Turkestan was made as a base map by Ellsworth Huntington for the American Commission to Negotiate Peace (the Inquiry) for their “Map of the Caspian Sea and of the region to the East,” to be used at the Paris Peace Conference.
Not only is the relief shown by some beautiful shading, but the annotations describe the contents of the map and show where map is to be altered and trimmed for the Inquiry’s purposes: “The shaded area shows the region between the Caspian Sea and the Sea of Aral which would be submerged if Aral should be filled to overflowing, and the Caspian should rise about 150 feet above the present level (after Konchin)”–[Ellsworth Huntington]. The map was one of over 700 items from our collection that were loaned to the Peace Conference at Versailles. All items that went were marked with the stamp or given a sticker that reads: “Loaned by the American Geographical Society to the Peace Conference at Versailles, 1918-1919.”
I use the map as a teaching tool to show how maps themselves are sometimes “in progress.” There are annotations all over the place, the title is scratched out, and there are notes to fix the shading in some places.
Post link


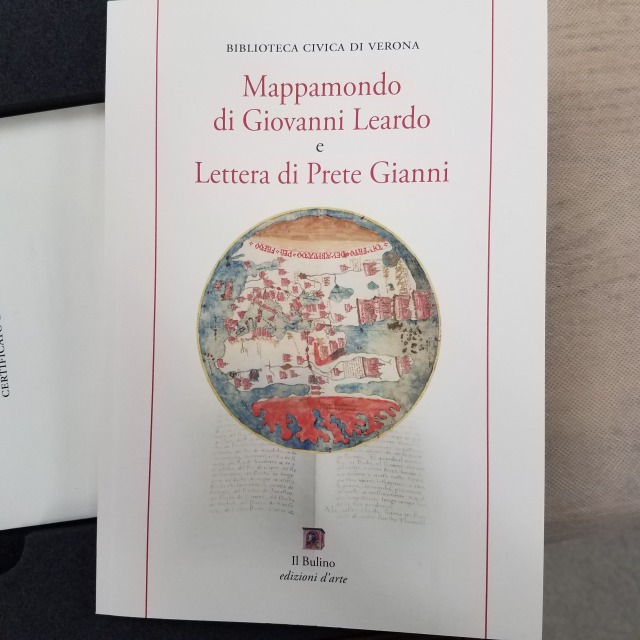


We got mail today! A facsimile of Giovanni Leardo’s 1442 Mapa Mundi is being added to the collection. If it looks familiar (check out our profile picture!), it’s becauee the oldest map in our collection is Leardo’s 1452 Mapa Mundi.
The 1442 map is held in Verona, Italy, & is the earliest of the three known Leardo works. His second map was made in 1448 & our map is the latest of the maps.
The green book that comes with the facsimile is the Letter of Prester John. The book is said to have inspired exploration in the centuries following its publication, making it a good companion piece for the map.

In honor of Native American Heritage month, we’re highlighting our new acquisition, The Story of Wisconsin Indians, created by Ludwig Cinatl, Jr. and featured in the Sunday, December 3, 1967 edition of The Milwaukee Journal.
The map shows Wisconsin place names in their original, pre-colonial language, historical information about different tribes, and has historical markers as early as the 100 BC depicting the beginning of the effigy mound culture. The bulk of the map depicts events between 1634 and the mid-1800s.
The map also includes 4 ancillary maps entitled: “Principal Indian Cessions 1829-1848” and “Location of Indian Tribes 1634,” “Location of Indian Tribes 1634-1750” and “Location of Indian Tribes 1750-1825.”
Post link

Presidential Debate 2020
Took a sip of our debate-orade this morning in preparation for the first Presidential Debate of 2020. This map depicts the Presidential Election results from all the elections from 1789 to 2008. It was originally published by the USGS in 2009 for the National Atlas of the United States of America.
You can check out this map at our Digital Collections. [Image description: The image is composed of multiple maps of the United States ranging from 1789 to 2008. Each map shows who each state voted for and what party they represent. The election year 2008, the most recent election from map publication, is larger than the rest and actually shows the break down of counties.]
Post link

This map is probably our most popular one. Students, researchers, and media outlets alike ask to see this map every semester. It is a 1938 Milwaukee County residential security map prepared by Division of Research and Statistics with the co-operation of the Appraisal Department of the Home Owners’ Loan Corporation. It corresponds with a binder filled with notes and information about each section listed. The scale consists of four colors: blue, green, yellow, and red. According to this company, blue and green represented good areas to give loans, and red and yellow represented bad areas to give loans.
Residential security maps are most often called redlining maps, and these maps from 80 years ago show how modern cities are affected by the past. What better example of systemic racism is there than to see mainly non-white communities labeled red on this map?
As one of the most segregated cities (if not the most segregated city) in America, this map shows roots of this problem. When I-43 was built, it was constructed in predominantly black communities. Not only was the interstate built where black people lived but in places where black businesses were successful. All of this I’ve learned from students and researchers who have come into the AGSL to tell this map’s story and its effect on our city today.
Call number: 893-c .M54 E-1938 2015
[Image description: A map of Milwaukee County, Wisconsin, showing different sections of the county in four colors: blue, green, yellow, and red.]
Post link

Happy #Feathursday
For today’s Bird’s Eye View, we present the Black Sea in 1877 called the Bird’s Eye View of the Seat of War. The map was published as part of the “Special war number of The Illustrated London News” on May 23, 1877. The map was published during the Russo-Turkish War of 1877-1878.
Call number: 716 A-1877
[Image description: A bird’s eye view map of the Black Sea in a pale blue with the land around it in brown. The brown ranges from light to dark depending on the topography. The country names are in black.]
Post link


Happy Birthday to Arthur Conan Doyle! To celebrate, we’re posting The Sherlock Holmes Mystery Map! The map was published in 1987 by Aaron Blake Publishers, who has a series of Literary Maps. The creator was Jim Wolnick, and the graphics were done by Susan A. Lewis. The map shows Sherlock’s adventures around London and England.
Call number: 622 M-1987
[Image description: The first image shows the front and back covers of the map. The left half has a text description of the maps contents, and a smaller replica of the map at the top. The right side has a graphic of Sherlock and Watson, and the title The Sherlock Holmes Mystery Map. The second image has two circular maps in the middle of images of Sherlock and Watson on various adventures. The left circle is a map of southern England dotted with numbers corresponding with cases. The right circle shows London with the similar numbers corresponding with cases.]
Post link

Today’s map is an Office of Strategic Services Map of Madagascar. The OSS, a division of the United States government, made thousands of maps during World War II. This map was made in 1942, and then gifted to the American Geographical Society in 1945, as seen on the stamp in the upper left hand corner. The shading depicts the topography of the island.
Call number:
050-b B-var OSS 526 [1942?]
[Image description: The island of Madagascar is white with shading for the mountains in the middle of a navy ocean. “Gift of the Office of Strategic Services Jul 19 1945″ is stamped at the upper left.]
Post link

Manuscript Map Monday
Today’s map comes from the Second Grinnell Arctic Expedition from 1853-1855. This manuscript map, drawn with watercolor, shows the region around Grinnell LandandDe Haven Bay in the Canadian Arctic Archipelago, and relief is shown by hachures.
This expedition was financed by Henry Grinnell and led by Elisa Kent Kane. They undertook the journey in an effort to find the lost Franklin Expedition, which embarked from England in 1845.
Call number: 061-c .G74 A-[1854]
[Image description: This watercolor map shows landmarks around the Canadian Arctic Archipelago in red and black. Larger landmarks include The Queens Channel, De Haven Bay, Mt. Franklin, and Wellington Channel.]
Post link

Today is the 75th anniversary of V-E Day. This map comes from the 84th Infantry Division, following their path from October 15, 1942 to V-E Day. The map was drafted by T/4 George D. Harney, and it shows routes and dates of operations from Paris to Elbe River, Germany. The map includes illustrations.; Insets include: Route from Camp Howze, Louisiana, to Omaha Beach, France; the Siegfried Line and Roer River area; and the Battle of Ardennes area. It was annotated by Carlos Wade Nichols who served as a tank gunner in Company D of 771st Tank Battalion, born 12-27-1916.
[Image description: A map showing the path of the 84th Infantry Division going from France to Germany over the course of three years. Red arrows depict the forward progression of the unit. A crumbling swastika is depicted where Berlin is located. There are three inset maps showing different battles and areas with more detail.]
600-c .R6R5 B-[1945?]
Post link
, lead expeditions to the Arctic from 1926-1941, where she focused")
, lead expeditions to the Arctic from 1926-1941, where she focused")
, lead expeditions to the Arctic from 1926-1941, where she focused")
Louise Arner Boyd (pictured above), lead expeditions to the Arctic from 1926-1941, where she focused on polar geography and photography. The map featured hand written annotations by Louise Boyd in red to show: icebergs, noon positions, heavy ice, slack ice, ice edge, Danish vessel “Gustav Holm,” routes and dates. The third photo is Louise Glacier at Avannaarsuani Tunumilu Nuna Allanngutsaaliugaq (Northeast Greenland National Park), formerly known as Louise Boyd Land.
Map’s call number: 110-b B-1931 Boyd Expedition of 1931
[Image description 1: A photo of Louise Arner Boyd with her hair pulled back in a net. She wears a sport coat jacket and large flower brooch. Image 2: A map of the Arctic Ocean and the Greenland Sea with red annotations by Boyd. Image 3: A black and white photo of a glacier.]
Post link

If this doesn’t resemble a Star War, I’m not sure what does! To celebrate May 4th, enjoy this page titled Le Taureau, from John Flamsteed’s Celestial Atlas, published in 1795. Flamsteed was the first Royal Astronomer in England, and this atlas was published seventy-six years after his death.
[Image description: A map of the stars centered on a large bull, the Taurus, fighting Orion.]
Call number: Rare 000 A-1795
Post link


May Day
These images of Tokyo come from our Harrison Forman Collection. Forman took these photos of a May Day Demonstration celebrating workers and laborers in Japan in 1972. This day can also be known as International Workers Day, Workers Day, or Labor Day. The day is celebrated with parades, barbecues, and demonstrations like this one featured above. Many countries celebrate their Labor Days on May 1st, with notable exceptions United States and Canada celebrating on September 1st.
[Image description: A large gathering of Japanese workers in Tokyo with red flags and political signs in front of pine trees.]
Post link


#TopoTuesday
Today’s map is a manuscript map of a volcano on Barren Island in the Andaman Sea, to the west of the Andaman and Nicobar Islands in the Indian Ocean. The caption of the map reads: “A View of the Volcano on Barren Island bearing East about one Mile off, taken on board the hon'ble Companyo ships now Viper March 23 1799″
[Image description: A pictorial scene of an island, seen from sea, with billowy, black clouds escaping a volcano in the middle of the island. A ship sails to the center right of the island.]
Rare 740-b A-var
Post link


Happy National Library Week!
In honor of this week, here are some photos of when our library made it to Milwaukee! The first photo is moving trucks arriving to the library building, with a crowd awaiting it. Next is the card catalogs being placed in the AGSL, where they still reside today. Thousands of cards, some handwritten, were moved from New York City. Jovanka Ristic, who is the current Reference Librarian, is pictured cataloging a map, and in a map printed shirt! The last photo depicts “Susan Peschel [the current Visual Resources Librarian] inputs Current Geographical Publications with a microcomputer. Automation at last!” Some captions or were words were taken from Current Geographical Publications, Volume 51, number 11, December 1988.
Post link


Happy Earth Day
This Earth Day enjoy a map from 2015. It was illustrated by Steve Evans and published by Harper Collins Publishing. It shows a vartiey of people, animals, and creatures (Monster Monday, anybody?) from around the globe.
What is your favorite animal shown? Mine is the octopus with the ship in its tentacles!
050 M-2015
[Image description: A colorful pictorial map of the world shows people, animals, and mythical creatures from all over the earth.]
Post link


#Map Librarianship Monday
The state of map librarianship in the middle of the 1950s can be visualized in this map, Map Collections in the United States and Canada.It was made by Patricia Ann Greechie Alonso in 1954, based on the Directory of Map Librarians and Collections, and the data were compiled by Marie Cleckner Goodman, who was the Chairperson of the Map Resources Committee of the Geography and Map Division of the Special Libraries Association. According to the directory and the map, there were 527 map collections in the United States and Canada (497 and 30 respectively). Twenty-five of these collections had more than 100,000 sheets, and for context, the AGS Map Department with Curator Ena L. Yonge’s acquisitions expertise had amassed 240,000 sheets by 1954.
800 C-[1954?]
[Image description: Black and white map of the United States and Canada showing the amount of librarians per map library in each state and province by ratio.]
Post link


This map of Liberia comes from “Liberia Today,” a publication made by the United States Embassy in Liberia in 1955. This issue of the publication Vol. 4, No. 2. The map’s Note shared that: “Areas in which water courses are shown by continuous lines are mapped from the U.S. Army’s aerial survey “Casey Jones” and where shown by broken lines are taken from reconnaissance maps by De Groot, Harley, and Mellish.” The Note section fails to mention the coloration of the business sections of the map.
326 E-1955
Post link


It’s #MonsterMonday!
This map, Polus Arcticus, inspired by William Barents’ three voyages to the Arctic regions in 1594, 1595, and 1596, was made by Gerrit de Veer in 1598. This version was published by the Hakluyt Society in 1876. The map includes illustrations and notes and was removed from: The Three Voyages of William Barents to the Arctic Regions, (1594, 1595, and 1596). The first edition was edited by Charles T. Beke, and printed for the Hakluyt Society in 1876. One of the chapters of the book is entitled “True portraiture of our boats and how we nearly got into trouble.”
061 A-1598 1876
Post link


#PhotoFriday
These photos feature flower markets in Jaipur, India, circa the 1950′s and 1960′s. According to the photographer’s notes, the flowers were to be used for weddings or funerals. The photos come from the Harrison Forman collection.
Post link