ANSTO has contributed to research led by the University of Sydney, involving doping transition metals in a polymorph of bismuth oxide in a search for more structural stability.
Cubic high-temperature polymorph of bismuth oxide, δ-Bi2O3, is the best known oxide ionic conductor but its narrow stability range (729—817 °C), which is close to its melting temperature of 817 °C precludes its practical use.
A large collaboration, led by Professor Chris Ling and Dr. Julia Wind (as part of her Ph.D.) from the University of Sydney involving researchers from ANSTO and two other universities, has achieved the design and understanding of the complex crystal structure and chemistry behind a commensurate structure within the fast-ion conducting stabilised bismuth oxide, co-doped with chromium and niobium, Bi23CrNb3O45.
The study was published in the Chemistry of Materials.
The miniaturization of spectroscopic measurement devices opens novel information channels in medical science and consumer electronics. Scientists of the University of Stuttgart, Germany, developed a 3-D-printed miniature spectrometer with a volume of 100 by 100 by 300 μm3 and a spectral resolution of up to 10 nm in the visible range. This spectrometer can be manufactured directly onto camera sensors, and a parallel arrangement allows for quick (“snapshot”) and low-profile, highly customizable hyperspectral cameras.
Femtosecond direct-laser writing as a 3-D printing technology has been one of the key building blocks for miniaturization in recent years. It has transformed the field of complex micro-optics since the early 2000s. Medical engineering and consumer electronics benefit from these developments. It is now possible to create robust, monolithic and nearly perfectly aligned freeform optical systems on almost arbitrary substrates such as image sensors or optical fibers.
Simultaneously, the miniaturization of spectroscopic measurement devices has been advanced with quantum dot and nanowire technology. These are based on computational approaches, which have the drawback of being calibration-sensitive and require complex reconstruction algorithms.
Researchers have developed a microscope that can chemically identify individual micron-sized particles. The new approach could one day be used in airports or other high-security venues as a highly sensitive and low-cost way to rapidly screen people for microscopic amounts of potentially dangerous materials.
In the journal Optics Letters, from The Optical Society (OSA), researchers from the Massachusetts Institute of Technology’s Lincoln Laboratory, USA, demonstrated their new microscope by measuring infrared spectra of individual 3-micron spheres made of silica or acrylic. The new technique uses a simple optical setup consisting of compact components that will allow the instrument to be miniaturized into a portable device about the size of a shoebox.
“The most important advantage of our new technique is its highly sensitive, yet remarkably simple design,” said Ryan Sullenberger, associate staff at MIT Lincoln Labs and first author of the paper. “It provides new opportunities for nondestructive chemical analysis while paving the way towards ultra-sensitive and more compact instrumentation.”
The traditional oil paints popular up to the 19th Century were made by grinding pigments with linseed, walnut or poppy seed oil – but while they produced stunning hues, their drying time meant that it could could take months or even years to complete a painting if several layers of colour were used.
Artists like JMW Turner understandably didn’t want to spend their lives watching paint dry, so they collaborated with chemists to produce gels that could be added to oil-based paints to shorten drying times.
The supramolecular structure of the gel is revealed by freeze fracture electron microscopy. Aa frozen specimen is fractured along natural planes, making an impression or replica of the exposed surface,then examined using transmission electron microscopy. Credit: LAMS (CNRS/UPMC)
They found that lead, in its acetate form, is essential to the formation of these gels. But other questions remained – how do they bind with the paint? How do they age?
The researchers reconstituted the original paint formulas and were able to reproduce the gels using lead and mastic to study their rheological properties, such as flow and deformation behaviour. They found that even minute amounts of the gels would modify the characteristics of the paint, yielding superior elastic properties.
On canvas, the consistency of gels and gel-paint mixtures differs greatly from that of paint alone, which spreads without retaining volume. Credit: Hélène Pasco, LAMS (CNRS, UPMC)
Using spectroscopic techniques, they defined the molecular interactions of the hybrid organic-inorganic gels and the mechanisms of the gelling process. They found that the lead not only catalysed the gelling process but contributed to the structure of the medium itself.
The challenge, now, is to understand how the lead binds with the resin and which conditions are best and worst for their conservation.
An international research project led by Kazuyuki Takeda of Kyoto University and Koji Usami of the University of Tokyo has developed a new method of light detection for nuclear magnetic resonance (NMR) by up-converting NMR radio-frequency signals into optical signals.
This new detection method, appearing in the journal Optica, has the potential to provide more sensitive analysis compared with conventional NMR. Its possible utilization in higher-accuracy chemical analysis, as well as in magnetic resonance imaging (MRI) technology, are also of interest.
NMR is a branch of spectroscopy in which scientists measure the spin of an atom’s nucleus in order to determine its identity. Atomic nuclei subjected to a magnetic field induce radio-frequency signals in a detector circuit. Since different atoms cause signals at different frequencies, scientists can use this information to determine the compounds contained in a sample. The most well-known application of this is in MRI-based imagining, such as CT scans.
“NMR is a very powerful tool, but its measurements rely on amplification of electrical signals at radio-frequencies. That pulls in extra noise and limits the sensitivity of our measurements,” explains Takeda. “So we developed an experimental NMR system from scratch, which converts radio-frequency signals into optical ones.”
** This note was inspired from a comment on one of our previous post. Do check it out before you read this one.
The emission spectrum of atomic hydrogen is given by this amazing spectral series diagram:
Let’s take a closer look at only the visible portion of the spectrum i.e the Balmer series.
If a hydrogen lamp and a diffraction grating just happen to be with you, you can take a look at the hydrogen lamp through the diffraction grating, these lines are what you would see:
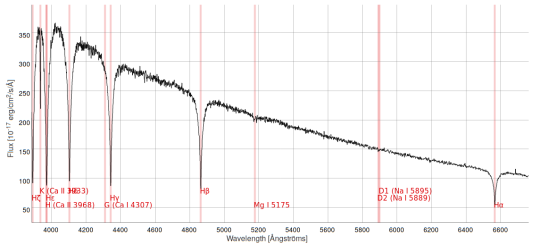
You can clearly see the Balmer series of hydrogen beautifully encoded in this spectrum that was taken from a star that is light-years away.
And astronomers learn to grow and love these lines and identify them immediately in any spectrum, for they give you crucial information about the nature of the star, its age, its composition and so much more.
Antiprotonic helium consists of an electron and antiproton that orbit around a helium nucleus. The hyperfine structure of this exotic type of matter is studied very closely by a CERN experiment in Japan called ASACUSA (AtomicSpectroscopyAndCollisionsUsing Slow Antiprotons) using laser spectroscopy.
To create antiprotonic helium, antiprotons are mixed with helium gas so that they spontaneously remove one of the electrons that orbit around each of the helium atoms and take their places. However, this reaction will only occur for 3% of the gas.
From the time that antiprotonic helium is created, the antiprotons orbiting the helium nucleus will only remain in orbit for a few micro seconds until they fall rapidly into the nucleus, causing a proton-antiproton annihilation. Surprisingly, antiprotonic helium has the longest lifetime of all the other antiprotonic atoms.
Laser Spectroscopy
ASACUSA physicists used a laser pulse (that if tuned correctly) will let the atom of antiprotonic helium absorb just enough energy so that the antiproton can jump from one energy level (aka orbit) to the other. Thus allowing physicists to determine the energy between orbits of an atom. Currently, laser and microwave precision spectroscopy of antiprotonic helium atoms is ASACUSA’s top priority. (Which is basically using two laser beams and pulsed microwave beams to further explore the ‘hyperfine energy levels’ of antiprotonic helium.)