#science

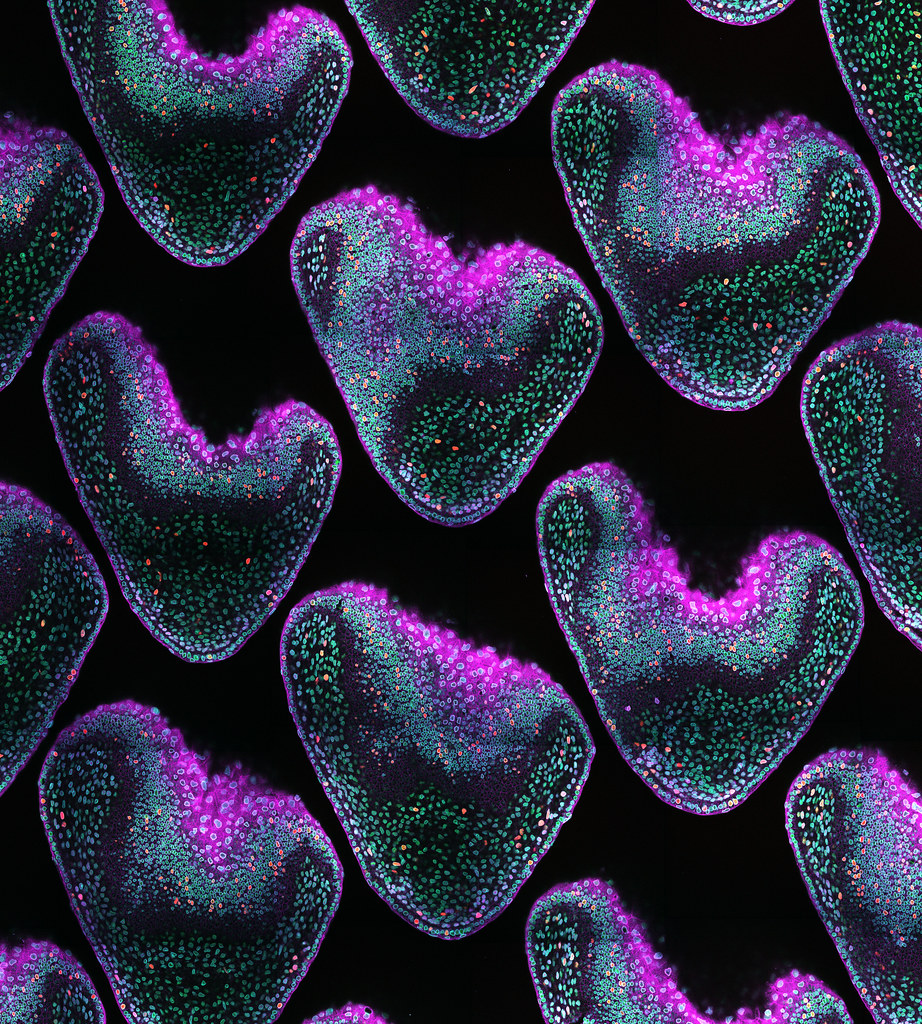
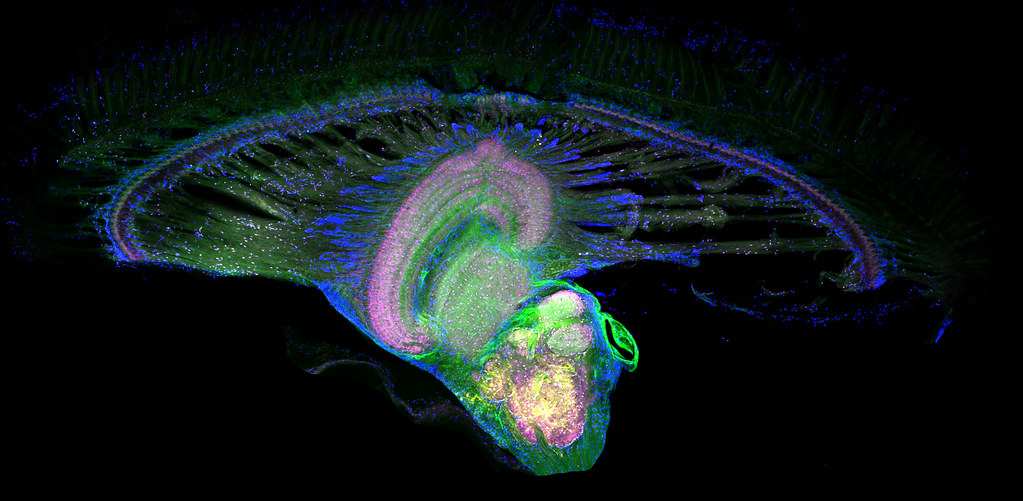
“From a snake embryo with love” by Grigorii Timin, University of Geneva by SNSF Scientific Image Competition
Via Flickr:
Entry in category 1. Object of study; Copyright CC-BY-NC-ND: Grigorii Timin Development is generally described phenomenologically by the corresponding dynamics of gene expression and the observed morphological changes. Another approach, combining biological and physical processes, consists in the quantitative assessment of the time evolution of 3D spatial distributions of cell differentiation, proliferation, migration and signalling as well as the mechanical properties of the corresponding tissues. Implementation of these parameters in numerical simulations allows identifying their relative importance in the morphogenetic process. My PhD research, under the supervision of Pr. Michel Milinkovitch at the University of Geneva, includes such a multidisciplinary analysis applied to the development of skin scales in snakes. The image is a single focal plane from a 3D confocal scan of a cleared whole-mount African house snake embryonic skin sample stained for proliferating cells (red), beta-catenin (magenta), nuclear envelope lamin (cyan) and nuclei (green).
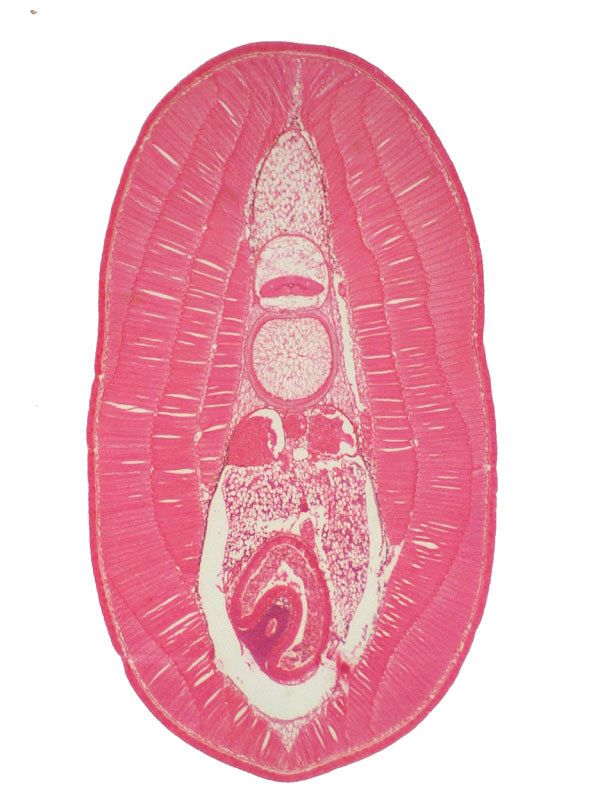
D5_009_coupe transversale niveau abdominal_cross section abdominal level_ammocète ammocoete Lampetra fluviatilis by Franck Genten
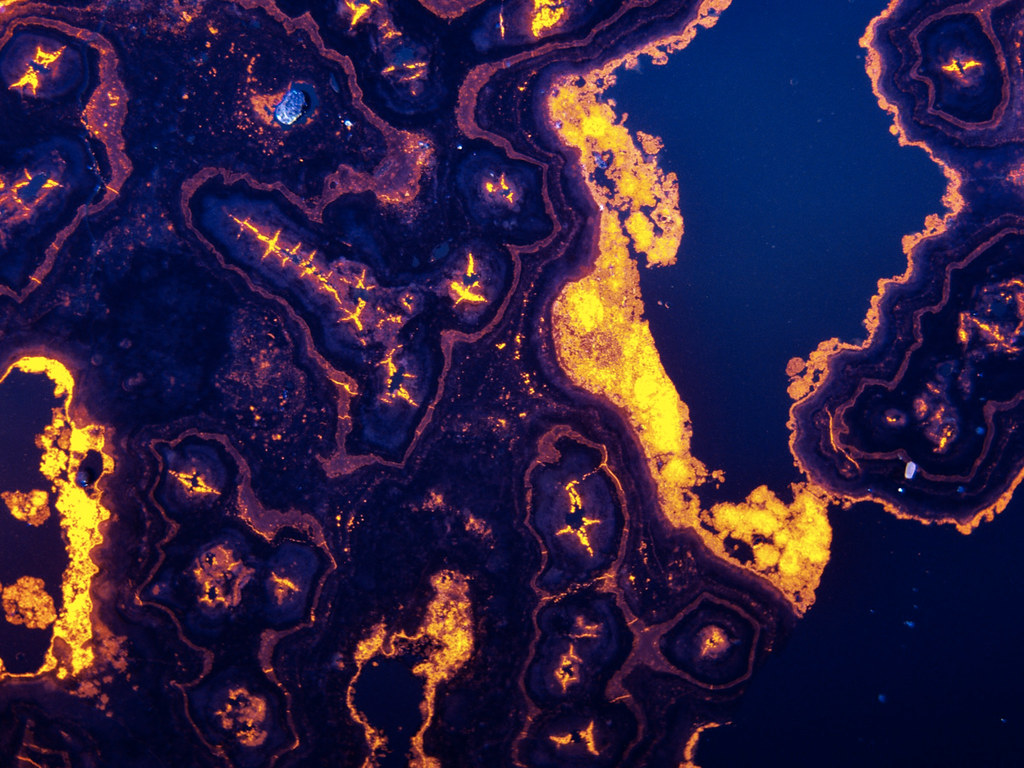
“Cathodoluminescence enlightening the origin of carbonates” by Clément Pollier, University of Geneva by SNSF Scientific Image Competition
Via Flickr:
Entry in category 1. Object of study; Copyright CC-BY-NC-ND: Clément Pollier Picture of a thin-section of microbialite under cathodoluminescence microscopy. The intensity of luminescence is proportional to the amount of trace elements present in the calcite, which is useful for studying the history of rock formation. These carbonates, precipitated by cyanobacteria, were collected at the Laguna de Los Cisnes (Tierra del Fuego, Chile) as part of my master thesis in geology. This image reveals concentric structures representing different phases of calcite cementation that have developed around a cyanobacterium filament that has now disappeared (leaving the cavity in the center).

Num5_SeaIce_20um_10X_04192018_2by Jack P.
Via Flickr:
This album is part of the NZAC Series, a collection of photographs from an expedition to Antarctica in 2018. It was from New Zealand (NZ) to Antarctica (A) to Chile ©, hence NZAC. A group of international researchers embarked on this journey in Lyttelton, New Zealand, where the researchers and crew boarded the South Korean icebreaking research vessel, ARAON. The vessel sailed across the Antarctic Circle and eventually arrived at its destination in the Weddell Sea region of the Antarctic Peninsula. During this expedition, research activities were carried out which include helicopter operations and anchoring near the King Sejong Station. Finally, the vessel crossed the Drake Passage and docked in Punta Arenas, Chile where the expedition concluded.
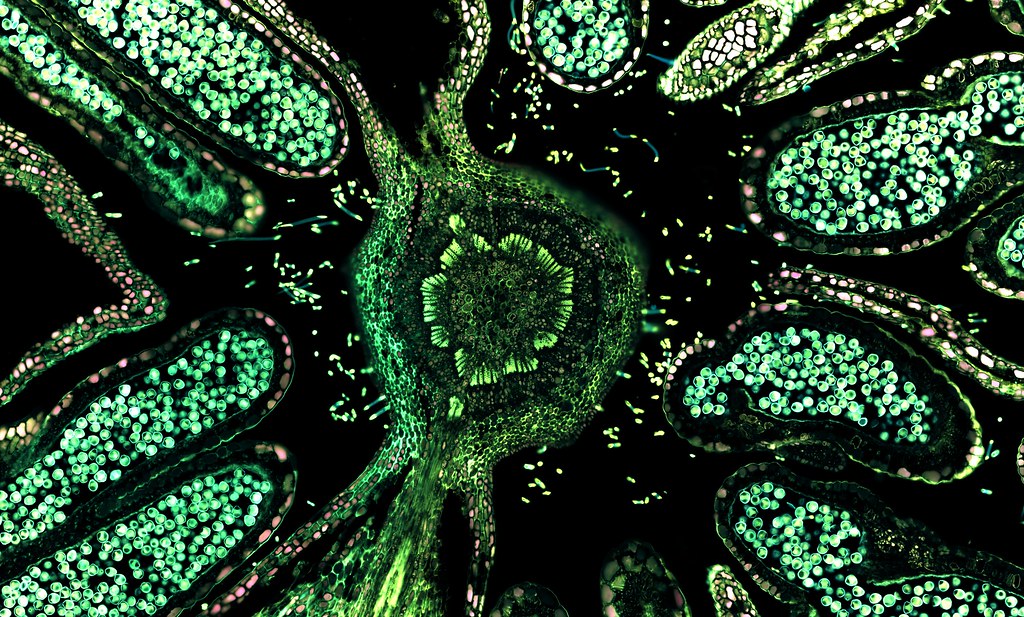
Hazelnut (male flower), overlay of 7 channel autofluorescence microscopy by ZEISS Microscopy
Via Flickr:
Hazelnut (male flower), overlay of 7 channel autofluorescence microscopy. Imaged with ZEISS Axio Observer, Axiocam, Colibri 7. www.zeiss.com/axioobserver
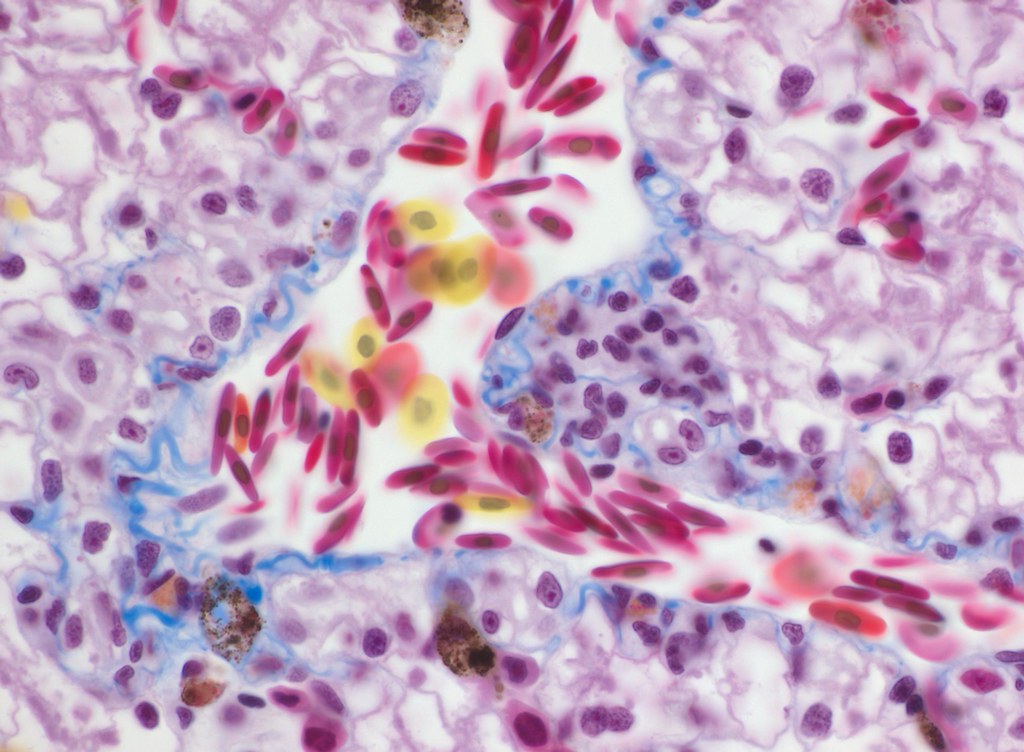
Transmitted light brightfield microscopy of toad liver by ZEISS Microscopy
Via Flickr:
Transmitted light brightfield microscopy of toad liver www.zeiss.com/microscopy
Colour through the Eye of a Mantis Shrimp by ZEISS Microscopy
Via Flickr:
The retina and underlying optic lobes of a mantis shrimp have been stained to reveal the many different units of light information processing before it reaches the central brain. Alexa Fluor probes on fixed mantis shrimp brain section embedded in VectorShield H1000 and imaged with ZEISS LSM 710 confocal microscope www.zeiss.com/lsm Courtesy of Elise Roberts, Honours Student, Marshall Lab, Queensland Brain Institute QBI
 and #nuclei using DAPI (green). T")
#mitochondria stained using #immunofluorescence for TOM20 (orange) and #nuclei using DAPI (green). To show the morphology of MEF cells, they used bright field #microscopy (detection with TPMT) . For confocal #imaging they utilized a @zeiss_micro LSM 710 at the LMF @DZNE_en.
Image courtesy of Christian Lamberg, PhD (@Christi23003438 on twitter) (see original post)
Post link

 and DNA (cyan)")
Multiphoton fluorescence image of HeLa cells with cytoskeletal microtubules (magenta) and DNA (cyan). Nikon RTS2000MP custom laser scanning microscope.
Source: National Center for Microscopy and Imaging Research (NCMIR) (source)
Credit Line: National Center for Microscopy and Imaging Research
Post link


#Lipilight#MemBright and super resolution #LiveSR on living muscle cells! by Bruno Cadot
Visit website : https://cadotbruno.com
Visit Bruno’s Twitter : https://twitter.com/cadotbru
Post link


Top: Drawings of mitosis in newt cells found in W. Flemming, Zellsubstanz, kern und zelltheilung (Verlag Vogel, Leipzig, 1882). (A to J) During prophase (A to C) the chromosomes form within the nucleus from a substance termed “chromatin” because of its affinity for dyes. After nuclear envelope breakdown (D), the chromosomes interact with the two separating “centrosomes” (E) to form a spindle-shaped structure (E and F). After the chromosomes attach to the spindle, they become positioned on its equator, halfway between the two poles (G). Once this “metaphase” stage is achieved, the two chromatids comprising each chromosome disjoin and move toward the opposing poles (G and H). During the final stages of mitosis, neighboring chromosomes within the two groups fuse to form the daughter nuclei (H and I), and the cell becomes constricted between them (I) by cytokinesis. (J) Drawing from Schrader’s (2) book depicting conspicuous chromosomal (kinetochore) fibers during early anaphase inLilium.
Bottom: (A to H) Fluorescence micrographs of mitosis in fixed newt lung cells stained with antibodies to reveal the microtubules (green), and with a dye (Hoechst 33342) to reveal the chromosomes (blue). The spindle forms as the separating astral MT arrays, associated with each centrosome (A to C), interact with the chromosomes. Once the chromosomes are segregated into daughter nuclei (F and G), new MT-based structures known as stem-bodies form between the new nuclei (G). These play a role in cytokinesis (H).
Post link
 and after (right) deconvolution.")
Widefield fluorescence microscopy of Paramecium spec. before (left) and after (right) deconvolution.
Source : Leica Microsystems
Post link

“The wound is the place where light enters you” - Rumi
*Drawing anatomy is the second best thing to do after drawing free patterns because yay science.
http://kristamillerart.tumblr.com
Post link

#PrehistoricPlanet #Paleontology #Science #Dinosaur #Dinosaurs #Fossil #Fossils #Geology #Biology #Zoology #Prehistoric #Documentary #Nature
https://www.instagram.com/p/CeATQc6scCk/?igshid=NGJjMDIxMWI=
Post link

#PrehistoricPlanet #Paleontology #Science #Dinosaur #Dinosaurs #Fossil #Fossils #Geology #Biology #Zoology #Prehistoric #Documentary #Nature
https://www.instagram.com/p/Cd9mgN4MMLL/?igshid=NGJjMDIxMWI=
Post link

#PrehistoricPlanet #Paleontology #Science #Dinosaur #Dinosaurs #Fossil #Fossils #Geology #Biology #Zoology #Prehistoric #Documentary #Nature
https://www.instagram.com/p/Cd7gPMROccd/?igshid=NGJjMDIxMWI=
Post link

#PrehistoricPlanet #Paleontology #Science #Dinosaur #Dinosaurs #Fossil #Fossils #Geology #Biology #Zoology #Prehistoric #Documentary #Nature
https://www.instagram.com/p/Cd7gPMROccd/?igshid=NGJjMDIxMWI=
Post link