#demographics

Welcome to the 40-somethings Club!

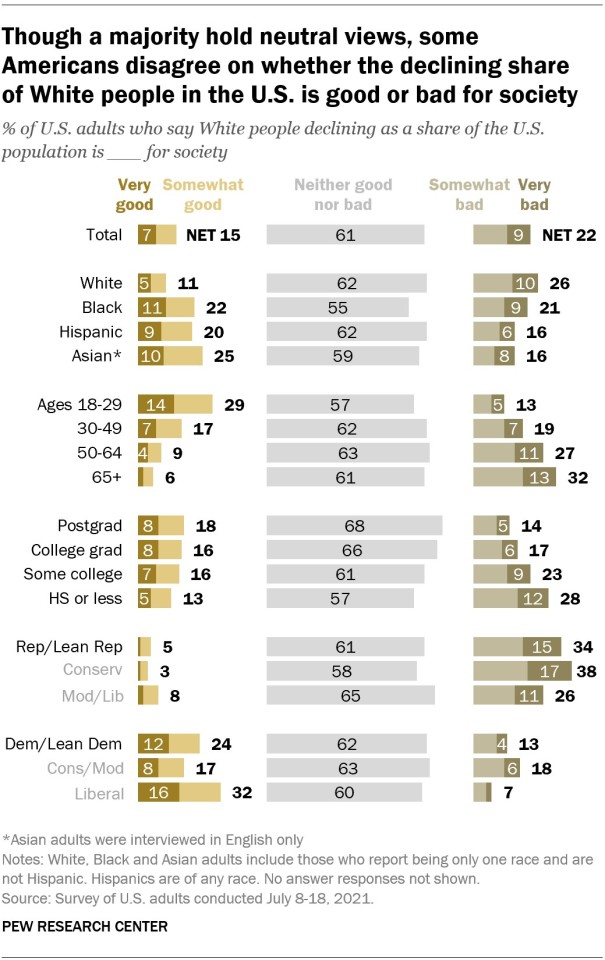
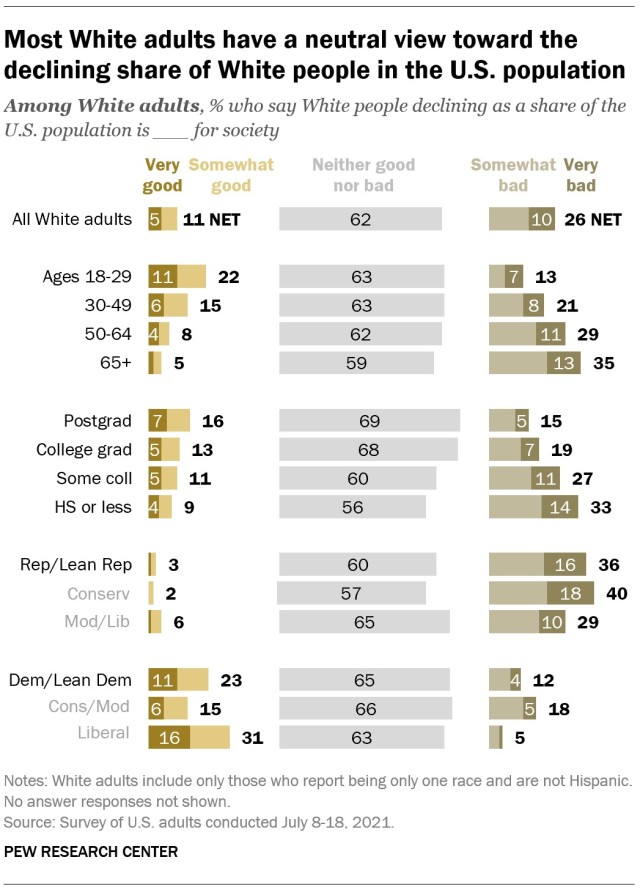
Source: Pew Research Center

Dimitris Ballas,Danny Dorling and Benjamin Hennig present figures from their new ‘Social Atlas of Europe’, which provides a new way of illustrating the key social and geographic features across European countries. They argue that by viewing Europe in this way it becomes apparent that most of the real social divides across the continent are within states rather than between them.
On 19 September 1946, Winston Churchill stated that: “we must re-create the European family in a regional structure, called, it may be, the United States of Europe”. This idea of a Europe of Regions and of a European People instead of a Europe of nation-states has long been at the heart of the thinking and efforts that have gradually led to the creation of the European Union. Nevertheless, the recent ascendancy of populist groups and the so-called ‘Eurosceptic earthquake’ in the recent European parliament elections have contributed to the painting of a picture of Europe where Euroscepticism is the dominant trend and where the revival of old nationalisms and divisions is inevitable.
Yet, a closer look at the evidence reveals a much more complex picture, which is convincingly argued by Ruth Wodak in her recent blog. In fact, and despite the significant rise of the votes for Eurosceptic parties, the overwhelming majority of votes and parliament seats were won by parties that are strongly committed to the European project. Perhaps the best example is the triumph of Italy’s centre-left Democratic Party whose leader, the Italian Prime Minister Matteo Renzi, in a speech delivered at the State of the Union before the European elections vowed to push for a United States of Europe during the Italian presidency.
It is also worth noting that according to the most recent Eurobarometer survey in Spring 2014 “close to two-thirds of Europeans feel that they are citizens of the EU (65 per cent of all those polled replying ‘yes’), after a 6 point rise since autumn 2013”. In addition, there is a small but rapidly growing number of formal and informal groups of Europeans (such as New Europeans,Bringing Europeans Together,One EuropeandEustory) who promote and celebrate the idea of a collective European identity and of a “European people” instead of a “nation-state” mentality.
Source:London School of Economics


Post link
This afternoon, I did some exploration work to discover some insightful details that will come in handy:
• 16-20 million active Facebook users
• 56% are men, 45% are women
• 25-34 year old age group represents a bulk of it
• 70% have attended college
• 44% are married
• most of whom are from in the Sales line and Management levels
• 35% are based in Kuala Lumpur
• 36% are Android mobile users
• 9% are iPhone, iPad, iPod users

I’ve been avoiding posting about politics for a while, but noticed this today, and I really couldn’t avoid commenting, particularly on the claim “that the Congressional delegation & state legislature will be red in perpetuity.”
I understand Run for Something is trying to gin up support for its efforts, so this kind of rhetoric is to be expected; however, it provides an opportunity to discuss some past and recent history.
The idea that partisan gerrymandering will make Texas red or blue in perpetuity ignores demographic change, which is how Texas became Republican in the first place, despite Democrat gerrymandering. This is an issue I’ve discussed at some length on this blog, specifically that due to demographic change (migration, economic/wealth shifts, etc.) the Republican party began to grow, especially in urban/suburban areas, eventually controlling the state legislature in 2003, when they promptly began to redraw the political maps.
See the following posts:
Republican Patterns in Urban-Rural Categories
More recently (2016-2018), we can see a similar trend. Only this time its suburban counties becoming Democrat, especially around Austin, DFW, and Houston. For example, in 2018, Beto won Hays, Fort Ben and Williamson counties - all of which had been Republican counties but have been trending Democrat. Democrats also won state legislative seats in these counties, as well as other previously Republican seats, which is why they only need 9 seats to flip the Texas House in 2020, and their targets are again in seats which are trending away from the Republicans in spite of any partisan gerrymanders.
See the following posts:
In other words, demographic change eventually overtakes partisan gerrymandering.
Post link


Hi! I’m Ruby, and I’m part of a group of researchers studying fanfiction communities through the University of Washington’s Human Centered Data Science Lab.
In November of 2017, we sent out a survey to all of you to learn a bit more about what motivates folks to participate in fanfiction communities, what kinds of activities you all participate in, and where your communities are. It’s been a hot minute, but I finally have some results to share!
We were absolutely blown away by your enthusiasm filling out our survey. We got a total of 1,888 responses from all over the world, which was way more than we ever could have imagined. Thank you all so much!
In this blog post, I’ll give a quick overview of participant demographicsand fan experience data. Then I’ll finish off with a preview of a few more blog posts to come!
Demographics
Survey participants’ demographic information matched well with previous fanfiction community censuses. (1,2,3,4) If you’re familiar with fandom spaces, this section shouldn’t be too much of a surprise.
Gender
The following chart represents the gender distribution of our participants. These percentages are not cumulative! Participants could check as many identities as applied to them.
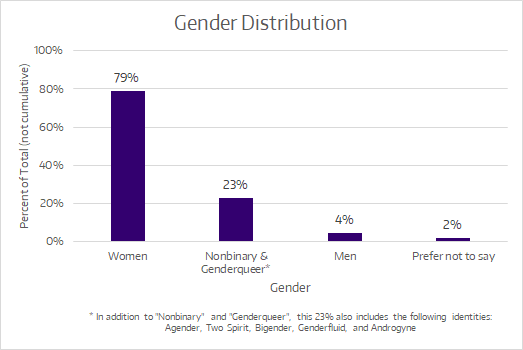
Gender identities that fall under the nonbinary and genderqueer umbrellas were aggregated for the purpose of this chart, but a comprehensive distribution will be shared in a more robust demographics post later on. Stay tuned!
Age
The age distribution of participant was pretty typical of fanfiction communities. This chart expresses the distribution as percentages. Children under 13 were excluded from filling out the survey.

Location
We collected some general location data and found that most of our participants were from the United States and Europe. That said, participants answered our survey from all over the globe. Here’s a map of where our participants were from.
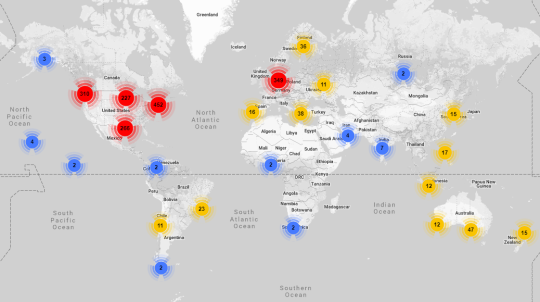
This map was created by aggregating coordinate data into different “buckets” based off of how close those locations were to one another. Each of the colored circles on the map represents one of these “buckets”. Any coordinate within a certain distance from the epicenter of each circle is included in the total displayed at the center of that circle.
To put that in context, the red circle over Germany doesn’t mean that there are 349 participants from Germany—it means that there are 349 participants from various locations around Europe, with the center of that bucket being located in Germany.
Blue circles represent buckets of 10 or fewer participants, yellow circles represent buckets of 100 or fewer participants, and red circles represent buckets of more than 100 participants.
Fandoms
Participants represented a great spread of different fandoms. Keep in mind that these results are from November 2017 through January 2018, so the fandoms represented in this word cloud are the ones that were popular among participants a year ago.

This word cloud only includes fandoms that were listed by ten or more participants. Although we did combine synonyms of fandom names (e.g. BNHA, My Hero Academia, MHA, etc. are synonyms of Boku no Hero Academia) we did not do any “meta-categorizing” (e.g. making Boku no Hero Academia a synonym of “Anime”). Therefore, the only fandoms included here are ones that were listed explicitly.
Fan Experiences
The biggest part of our survey delved into the activities that people in fanfiction communities participate in. We’ll give some more in-depth analysis of this data later, but for now, here’s a taste.
Personal History
First off, let’s talk about experience in terms of time. The following chart shows how long participants have been involved with online fanfiction communities.

Please keep in mind that each of these brackets are different sizes. The first bracket, “1 - 2 years”, represents only a 2-year span, while the fourth spans 10 years.
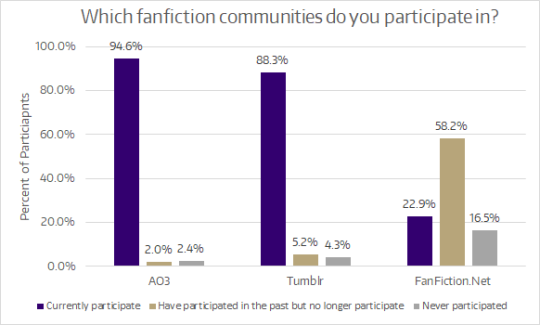
Which Fanfiction Communities?
Fans who filled out our survey were mainly based on tumblr and AO3, and most had used FanFiction.Net in the past. This is good to keep in mind, because the results from fans who favor other communities—say, Wattpad—might look very different. There is no one monolithic “fanfiction community”.
Activities
A significant portion of our survey questions asked participants to indicate how often they do various fanfiction-related activities. Although the complete list of activities was a lot longer, for this first overview post we’re just going to focus on three: reading fanfiction, writing fanfiction, and commenting on fanfiction.
Unsurprisingly,reading fanfiction was the most popular activity among our participants. About two-thirds of participants read fanfiction every day. Only 5 participants (0.3%) indicated that they’d never read fanfiction.

As for writing fanfiction, the distribution is much more even across the five frequency options. About a third of participants write fic at least once or twice a week, while another third write fic more infrequently (a couple times a month or less). The final third had not written fic or were no longer writing fic at the time of the survey.

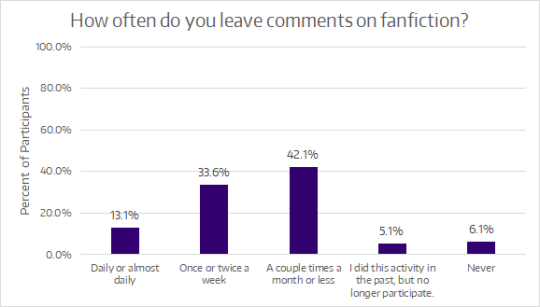
Leaving comments or reviews on fanfiction was a fairly ubiquitous activity. Nearly all participants (88.8%) reported that they do at least occasionally leave comments or reviews. Almost half of participants (46.7%) left comments at least once or twice a week.
What’s Next?
Now that I’ve shown you all a sample of the results from the survey, what else is there to see?
In the coming months, my research team and I will continue to post about additional findings from the survey results. Some of these posts may cover topics such as:
- Demographics and activity information by fandom
- Comparing age and different activities in fanfiction communities
- Expanded demographic information, especially for gender
In addition, we have a significant amount of data from long responses to our survey question, “What motivates you to participate in fanfiction communities?” Participant responses were incredibly rich and detailed, and there’s a lot of fantastic information to draw from them.
For now, that’s a wrap! Thanks for taking a look at our results. If you have any questions or want clarification on any of the data shared here, please don’t hesitate to reply to this post, reblog with a comment, or send an ask. I’ll be happy to clear up any confusion, if I can.
May the force be with you all,
Ruby Davis
Human-Centered Data Science Lab
University of Washington
Post link

that first map tho… damn
read the asterisk tho…
f u c k
So I should move to either Massachusetts, Maine, Hawaii, or Washington State…? Good to know…
Post link
The Los Angeles Homeless Services Authority (LAHSA) seeking 6,000 volunteers to assist with the 2015 Greater Los Angeles Homeless Count, which will take place countywide over three nights from January 27 to 29. Volunteers should register at www.TheyCountWillYou.org, to assist in their community. Dozens of deployment centers across LA County will host the nation’s largest street count of homeless community members.
The Homeless Count will cover L.A. County as follows:
- Tuesday, January 27 (8:00PM), San Gabriel Valley and East Los Angeles County
- Wednesday, January 28 (8:00PM), West Los Angeles and South Bay
- Thursday, January 29 (6:00AM), Antelope Valley
- Thursday, January 29 (8:00PM), San Fernando Valley/Santa Clarita Valley, Metro Los Angeles and South Los Angeles
Volunteers will be dispatched from 87 regional deployment centers to targeted census tracts throughout the county, to record the number of homeless people, vehicles used as homes and homeless encampments observed. Volunteers select their preferred deployment center when they register atwww.TheyCountWillYou.org.
The Count will follow definitions of homelessness established by the U.S. Department of Housing and Urban Development (HUD), which include people living in places not meant for human habitation, such as, cars, parks, sidewalks and abandoned buildings.
Demographic data will include such data as age, gender, ethnicity, individual and family homelessness, duration of homelessness, and veteran status. The volunteer registration website is: www.TheyCountWillYou.org.
If you have any questions, please contact [email protected].
Visit the CalVet website at www.calvet.ca.gov.

Annmarie on the show & the future of AMD
Introduction
Just weeks before the perennial end of the year bashes that ring in 2016, Annmarie Debrito can be found diligently at work, putting plans into place, writing, creating storyboards, interviewing candidates, prospecting, contacting sponsors, finalizing casting, etc. All the things needed to launch her first television production off the ground. From flights across the country, spontaneous road trips, presentations, meetings, contracts and budgets, it’s certainly not easy. But alas, the adventure, the drive and the excitement for new beginnings bekon the AMD Entertainment CEO and her wonderful crew. I, Ollie Montgomery, sat down with Annmarie for an AMA session to find out how she’s coping.
———————————
OM: What’s happening and what’s going on?
Annmarie Debrito: As of now…
I have completed the storyboards for each finalist up to date. Next, each of the finalists will have their green room session where we will be taping. From the green room sessions, that’s how we pick our final cast. Once the cast is complete, we begin filming.
OM: Why did you pick who you picked?
Annmarie Debrito: Typically people hold casting calls in a busy setting and it’s a fast process where they rush through a screening and its loud, chaotic, busy. I didn’t want that. I wanted to personally prescreen each person first. Then, if interested, invite them to a very thorough, intense interview with myself and my casting team. Once this is done, my casting team and I sit and talk and invite the person to become a finalist. We look for personality and make sure their life storyline fits in with what I am looking for.
OM: Describe your craziest interview moment
Annmarie Debrito: I place ads everywhere about what I am looking for and one of the places I placed an ad was on Craigslist. I had a woman call me and she drove from Connecticut to Rhode Island, where we met at a busy hotel lobby in Providence. When the interview was over, she told me she was glad she didn’t have to kick me in the face. She said she and her sister were nervous about coming to meet with me and they had a plan about how to put me down if I was trying to harm them. I thought it was hilarious. But I do understand why they would have felt that way.
OM: When are you filming?
Annmarie Debrito: Filming starts next week for cast. Show filming begins in January.
OM: Where are you filming?
Annmarie Debrito:We are going to jump-start the first location and film in New York City. The majority of the filming will be done, throughout the New England area. We intend to showcase all the beautiful locations that N.E. has to offer the American people. We are currently reaching out to several businesses in NE for location agreements. We want so showcase your business. If you would like to have your business showcased in a scene on a major tv network, email us at [email protected]
OM: When do you expect the show to air?
Annmarie Debrito: After the season is filmed. I have no control on when it airs. That is done by the network.
OM: Who is your target demographic?
Annmarie Debrito: My target audience is everyone who enjoys watching someone living their truth and sharing with the world; this includes sharing their aspirations and showing their growth, mistakes, and their success. Allowing acceptance of these women’s personal wrongs and rights and courage while they are broadcast their lives on national tv and sharing it with millions and finding your connection in each of their story or seeing their struggles and believing in them as I did.
OM: What can we fans do in the meantime?
Annmarie Debrito: Stay connected through our social sites, make sure you sign up for our newsletters. if you would like to be a part of this major project, you can email us at [email protected] or sign up on our website at www.amdent.com
OM: What events do you have coming up?
Annmarie Debrito: Meet our FINAL Cast event! And be in the lookout for our SUMMER HUGE Premier Red Carpet Affair with all the mover and shakers in the industry. My vision is always BIG and this event is going to be EPIC. NE won’t forget this event.

How do people in your world generally feel about cohabitation and how common is it?
Ashyrans as a whole are an asocial species and do not relish the idea of having to live in close proximity to members of their own kind. The idea of living or even being in large groups is frankly alien to them at best and anxiety inducing at worst.

Celebrating diversity
Today we celebrate the diversity of our community.
Pictured are the flags of our contributors: Hong Kong, Japan, Philippines, Portugal, Slovenia, Turkey, United Kingdom, United States. It’s wonderful to imagine philosophy being created for The Human Front from around the world.
We haven’t asked our contributors to identify their genders. Though both men and women contribute, we’d like more diversity. (Get in touch!)
Thanks to Google Analytics, here are some statistics about our readership.
A non-exhaustive sample of 15,607 users revealed the following distribution of readers:
- United States: 5,370 (34.46 %)
- United Kingdom: 2,603 (16.70%)
- Canada: 823 (5.28 %)
- India: 638 (4.09 %)
- Australia: 614 (3.94 %)
- Philippines: 529 (3.39 %)
- Germany: 286 (1.84 %)
- Brazil: 202 (1.30 %)
- Netherlands: 193 (1.24 %)
- Turkey: 183 (1.17 %)
Other nationalities identified include: Japan, France, Spain, Italy, New Zealand, Sweden, Mexico, Indonesia, United Arab Emirates, Denmark, China, South Africa, Pakistan, Singapore, Ireland, Greece, South Korea, Norway, Poland, Thailand, Austria, Portugal, Hong Kong, Romania, Argentina, Malaysia, Slovenia, Egypt, Russia, Belgium, Bangladesh, Finland, Nigeria, Kenya, Vietnam, Israel, Hungary, Serbia, Puerto Rico, Taiwan, Ukraine, Bulgaria, Switzerland, Saudi Arabia, Chile, Colombia, Czechia, Morocco, Croatia, Nepal, Ghana, Slovakia, Georgia, Algeria, Latvia, Albania, Estonia, Peru, Sri Lanka, Ethiopia, Bosnia Herzegovina, Lithuania, North Macedonia, Tunisia, Ecuador, Iraq, Malta, Trinidad & Tobago, Zambia … plus 70 more.
Using Instagram Insights, a 90-day sample revealed that, of 9,250 users, 64.6 % were men and 35.4 % were women.
The breakdown of age was as follows:
- 13 to 17: 1.8 %
- 18 to 24: 35.4 %
- 25 to 34: 44.8 %
- 35 to 44: 11.3 %
- 45 to 54: 3.9 %
- 55 to 64: 1.5 %
- 65+: 1.4 %
Thank you for being part of this journey, wherever you are in the world, whatever your gender is, and however old you are!
Post link
